
Wayground
Pie Charts: Interpretation and Analysis - Printable คณิตศาสตร์ Worksheets ระดับ 5 - Wayground

Pie Charts: Interpretation and Analysis

Allison Steffen

สร้างโดย Allison Steffen

20 คำถาม

5th ระดับชั้น

คณิตศาสตร์

อัปเดตแล้ว ต.ค. 2569

แบบฝึกหัดคณิตศาสตร์สำหรับชั้นประถมศึกษาปีที่ 5 เรื่อง แผนภูมิวงกลม: การตีความและการวิเคราะห์ ประกอบด้วยคำถามแบบเลือกตอบ 20 ข้อ ที่ช่วยพัฒนาความสามารถของนักเรียนในการอ่านและตีความแผนภูมิวงกลม นักเรียนจะได้ระบุแผนภูมิวงกลม อ่านชื่อเรื่อง รู้จักวิธีการแบ่งรูปทรงออกเป็นส่วนเท่าๆ กัน และใช้ส่วนต่างๆ ของแผนภูมิเพื่อระบุหมวดหมู่ที่ได้รับความนิยมมากที่สุดและน้อยที่สุดในบริบทที่คุ้นเคย เช่น รสชาติ กิจกรรม อาหาร การขนส่ง และกิจวัตรประจำวัน แบบฝึกหัดนี้ยังถามนักเรียนเกี่ยวกับการตีความเปอร์เซ็นต์ที่แสดงในแผนภูมิวงกลม และแยกแยะแผนภูมิวงกลมออกจากกราฟอื่นๆ รวมถึงกราฟแท่ง กราฟเส้น ฮิสโตแกรม และแผนภูมิเส้น แบบฝึกหัดนี้สามารถพิมพ์ได้ฟรี พร้อมเฉลยคำตอบครบถ้วน ทำให้มีประโยชน์สำหรับการฝึกฝนด้วยตนเอง การทบทวน หรือการประเมินทักษะการอ่านแผนภูมิของนักเรียนอย่างรวดเร็ว

การตั้งค่าแผ่นงาน

ขนาดตัวอักษร

S
M
L
XL
Waygroundแผ่นงาน

Pie Charts: Interpretation and Analysis

คำถามทั้งหมด: 20

ชื่อ
ระดับ
วันที่
1.
What type of graph is this?
a)
Bar graph
b)
Histogram
c)
Pie Chart
d)
Stem Chart
2.
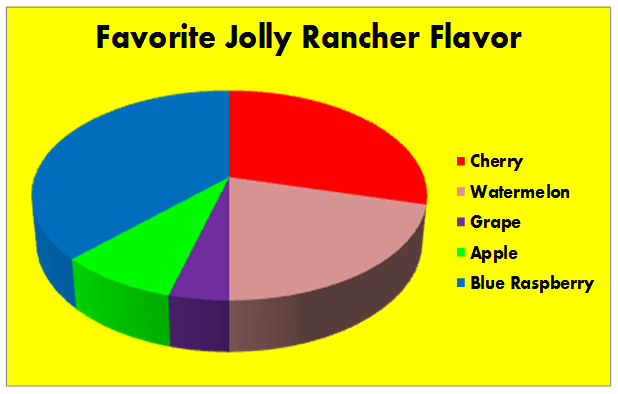
According to this graph, what is the most popular flavor of Jolly Rancher?
a)
Cherry
b)
Grape 
c)
Blue Raspberry
d)
Watermelon
3.
What is the title of this graph?
a)
School Transportation
b)
Bus
c)
No title
d)
Pie Graph
4.
What activity did campers enjoy the most?

What activity did campers enjoy the most?

a)

horseback riding

b)

camp fire

c)

crafts

d)

canoeing

5.
What activity did campers enjoy the least?

What activity did campers enjoy the least?

a)

horseback riding

b)

camp fire

c)

crafts

d)

canoeing

6.
Which ice cream is the most popular among the students?

Which ice cream is the most popular among the students?

a)

vanilla

b)

strawberry

c)

blueberry

d)

chocolate

7.
This shape is cut into ____________.

This shape is cut into ____________.

a)

Halves

b)

Fourths

8.
How many equal parts in this shape?

How many equal parts in this shape?

a)

1

b)

2

c)

3

d)

4

9.
What is name of the chart pictured below?

What is name of the chart pictured below?

a)

Line Graph

b)

Pie Chart

c)

Bar Graph

d)

Line Plot

10.
Which donut is eaten the least?

Which donut is eaten the least?

a)

Cream Filled

b)

Jelly Donut

c)

Plain Donut

d)

Chocolate Donut

e)

Cake Donut

11.
Which donut is eaten the most?

Which donut is eaten the most?

a)

Cream Filled

b)

Jelly Donut

c)

Plain Donut

d)

Chocolate Donut

e)

Cake Donut

12.
According to this graph, a cat's life is spent doing mostly what?

According to this graph, a cat's life is spent doing mostly what?

a)

Eating

b)

Resting

c)

Sleeping

13.
According to the graph, what percent of people own fish?

According to the graph, what percent of people own fish?

a)

6%

b)

30%

c)

55%

14.
According to this pie chart, most of our day is used for what?

According to this pie chart, most of our day is used for what?

a)

Listening to music

b)

Sleeping

c)

Playing Minecraft

15.
Which animal has of the pie chart.

Which animal has

14\frac{1}{4}  of the pie chart. 

a)

hamster

b)

dog

c)

cat

16.
Which animal has of the pie chart.

Which animal has

12\frac{1}{2}  of the pie chart. 

a)

hamster

b)

dog

c)

cat

17.
The pie chart represents 40 children. How many children chose summer?

The pie chart represents 40 children. How many children chose summer?

a)

10

b)

20

c)

5

18.
How many children chose spring?

How many children chose spring?

a)

10

b)

40

c)

20

19.
How many birds are represented by the green sector?

How many birds are represented by the green sector?

a)

5

b)

20

c)

9

d)

13

20.
According to this pie chart, what is our phone used for the MOST.

According to this pie chart, what is our phone used for the MOST.

a)

Making phone calls

b)

Text messaging

c)

Checking the time

Waygroundแป้นคำตอบ

Pie Charts: Interpretation and Analysis

คำถามทั้งหมด: 20

1.
c) Pie Chart
2.
c) Blue Raspberry
3.
a) School Transportation
4.
a)

horseback riding

5.
c)

crafts

6.
a)

vanilla

7.
a)

Halves

8.
d)

4

9.
b)

Pie Chart

10.
a)

Cream Filled

11.
d)

Chocolate Donut

12.
c)

Sleeping

13.
a)

6%

14.
a)

Listening to music

15.
c)

cat

16.
b)

dog

17.
b)

20

18.
a)

10

19.
c)

9

20.
c)

Checking the time

คำถามที่พบบ่อย

แบบฝึกหัดแผนภูมิวงกลมนี้ช่วยให้นักเรียนชั้นประถมศึกษาปีที่ 5 เรียนรู้อะไรบ้าง?

แบบฝึกหัดคณิตศาสตร์ชั้นประถมศึกษาปีที่ 5 นี้ประกอบด้วยคำถามแบบเลือกตอบ 20 ข้อ เพื่อสอนนักเรียนถึงวิธีการตีความแผนภูมิวงกลม นักเรียนจะได้ระบุประเภทและชื่อของแผนภูมิ รู้จักส่วนที่เท่ากัน เปรียบเทียบหมวดหมู่เพื่อหาตัวเลือกที่ได้รับความนิยมมากที่สุดหรือน้อยที่สุด และอ่านค่าเปอร์เซ็นต์ที่แสดงในแต่ละส่วนของแผนภูมิ

ฉันจะใช้แบบฝึกหัดนี้สอนนักเรียนเกี่ยวกับการตีความแผนภูมิวงกลมได้อย่างไร?

เริ่มต้นด้วยการสาธิตวิธีการระบุชื่อแผนภูมิ ส่วนต่างๆ และป้ายกำกับ จากนั้นให้คิดไปด้วยขณะเปรียบเทียบส่วนที่ใหญ่ที่สุดและส่วนที่เล็กที่สุด ก่อนที่นักเรียนจะทำข้อสอบแบบเลือกตอบ ให้ทบทวนว่าส่วนที่เท่ากันแบ่งส่วนทั้งหมดอย่างไร และเปอร์เซ็นต์ที่ระบุไว้สื่อถึงส่วนหนึ่งของส่วนทั้งหมดนั้นอย่างไร หลังจากนั้น ให้ถามนักเรียนว่าทำไมพวกเขาถึงเลือกคำตอบนั้นในบริบทที่คุ้นเคย เช่น กิจกรรม อาหาร หรือกิจวัตรประจำวัน

ฉันควรระวังข้อผิดพลาดอะไรบ้างเมื่อนักเรียนทำแบบฝึกหัดแผนภูมิวงกลมนี้?

นักเรียนอาจสับสนระหว่างแผนภูมิวงกลมกับแผนภูมิแท่งหรือแผนภูมิเส้น มองข้ามชื่อของแผนภูมิ หรือเลือกหมวดหมู่โดยไม่เปรียบเทียบขนาดของส่วนต่างๆ นอกจากนี้ พวกเขาอาจสลับคำว่ามากที่สุดและน้อยที่สุด นับส่วนที่เท่ากันในรูปทรงผิด หรือเลือกเปอร์เซ็นต์ที่ไม่ถูกต้องเมื่ออ่านส่วนที่มีป้ายกำกับ

ฉันจะมอบหมายและให้คะแนนใบงานแผนภูมิวงกลมนี้อย่างไร?

แบบฝึกหัดนี้มีให้ดาวน์โหลดในรูปแบบ PDF และแบบทดสอบดิจิทัลบน Wayground พร้อมทั้งเฉลยคำตอบครบถ้วน ตรวจคำตอบที่พิมพ์ออกมาโดยใช้เฉลย หรือสแกนงานของนักเรียนด้วยแอป Wayground for Teachers ตัวเลือกแบบพิมพ์ยังช่วยสนับสนุนโรงเรียนที่ต้องการลดเวลาการใช้หน้าจอได้อีกด้วย

ฉันจะปรับแบบฝึกหัดแผนภูมิวงกลมนี้ให้เหมาะสมกับนักเรียนของฉันได้อย่างไร?

ใช้การตั้งค่าขั้นสูงของแบบฝึกหัดเพื่อปรับระยะห่างระหว่างตัวอักษรหรือเพิ่มขนาดตัวอักษร เพื่อให้ป้ายกำกับแผนภูมิและตัวเลือกแบบปรนัยอ่านง่ายขึ้น นอกจากนี้ คุณยังสามารถเปิดใช้งานแบบอักษรที่เหมาะสำหรับผู้ที่มีภาวะดิสเล็กเซีย หรือแปลแบบฝึกหัดเป็นภาษาอื่นได้ โดยยังคงรักษางานการตีความแผนภูมิวงกลมไว้เหมือนเดิม

ฉันจะหาแบบฝึกหัดฟรีแบบนี้จาก Wayground ได้จากที่ไหนบ้าง?

Wayground นำเสนอชุดแบบฝึกหัดและโจทย์ฝึกหัดฟรีที่ครอบคลุมทุกวิชา พร้อมไฟล์ PDF และเฉลยคำตอบ เพื่อช่วยเสริมสร้างทักษะและความเข้าใจในแนวคิดสำคัญ ดูแหล่งข้อมูลเพิ่มเติมได้ที่ https://wayground.com/en-us/worksheets