

Histograms

Flashcard
•
Mathematics
•
6th Grade
•
Practice Problem
•
Easy
+4
Standards-aligned

Wayground Content
Used 2+ times
FREE Resource
Student preview

15 questions
Show all answers
1.
FLASHCARD QUESTION
Front
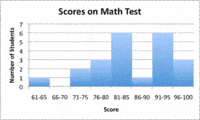
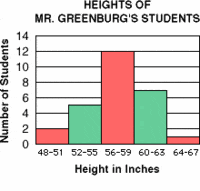
What type of graph is this? Options: Bar Graph, Histogram, Line Plot
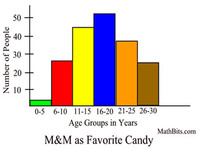
Back
Histogram
Tags
CCSS.6.SP.B.4
CCSS.HSS.ID.A.1
2.
FLASHCARD QUESTION
Front
What is the least value? Options: 52, 0, 13, 10

Back
0
Tags
CCSS.4.MD.B.4
3.
FLASHCARD QUESTION
Front
How many people watched more than 6 hours of TV?

Back
17
Tags
CCSS.2.MD.D.9
4.
FLASHCARD QUESTION
Front
More people had between __ and __ cups of coffee than any other range. Options: 0-3, 8-11, 12-15, 16-19
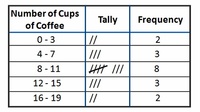
Back
8-11
Tags
CCSS.HSN.VM.C.6
5.
FLASHCARD QUESTION
Front
Which interval has 400 employees? Options: 33-43, 0-10, 77-87, 66-76
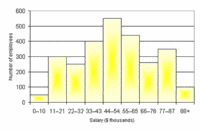
Back
33-43
Tags
CCSS.6.SP.B.4
CCSS.HSS.ID.A.1
6.
FLASHCARD QUESTION
Front
Which interval has the greatest number of employees? Options: 11-21, 33-43, 77-87, 44-54
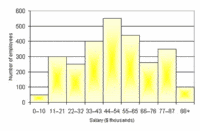
Back
44-54
Tags
CCSS.6.SP.B.4
CCSS.HSS.ID.A.1
7.
FLASHCARD QUESTION
Front
How many employees have a salary less than $22,000?

Back
350
Tags
CCSS.6.SP.B.4
CCSS.HSS.ID.A.1

Access all questions and much more by creating a free account
Create resources
Host any resource
Get auto-graded reports

Continue with Google

Continue with Email

Continue with Microsoft
or continue with

%20(1).png)
Apple

Others
By signing up, you agree to our Terms of Service & Privacy Policy
Already have an account?



