
Ratio Tables and Graphs
Flashcard
•
Mathematics
•
6th Grade
•
Practice Problem
•
Hard
+3
Standards-aligned

Wayground Content
FREE Resource
Student preview

10 questions
Show all answers
1.
FLASHCARD QUESTION
Front
What is the missing number in the ratio table? Options: 21, 24, 27, 25

Back
21
2.
FLASHCARD QUESTION
Front
Which statement matches the graph? Options: Taylor can write 6 words per minute, Taylor can write 25 words per minute, Taylor can write 50 words per minute, Taylor can write 150 words per minute

Back
Taylor can write 25 words per minute
Tags
CCSS.HSF.LE.B.5
3.
FLASHCARD QUESTION
Front
What is the ratio of the line graph shown?
Back
4:1
Tags
CCSS.7.RP.A.2D
4.
FLASHCARD QUESTION
Front
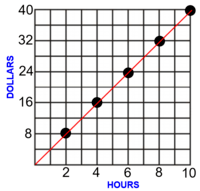
Which statement describes the graph? Options: For every 5 hours of work you get $6, For every 24 hours of work you get $10, For every 36 hours of work you get $50, For every 6 hours of work you get $5

Back
For every 6 hours of work you get $5
Tags
CCSS.7.RP.A.2D
5.
FLASHCARD QUESTION
Front
Which of the following tables use a 1:2 ratio?
Back

6.
FLASHCARD QUESTION
Front
A store is having a sale on DVDs. The sale price of 3 DVDs is $12.00. Which table shows this relationship?
Back

Tags
CCSS.7.RP.A.2A
7.
FLASHCARD QUESTION
Front
The graph shows the cost of buying paint in 1-gallon buckets. Based on the graph, which dollar amount represents the cost to buy five 1-gallon buckets of paint? $120, $125, $130, $135

Back
$125


Access all questions and much more by creating a free account
Create resources
Host any resource
Get auto-graded reports
Continue with Google

Continue with Email
Continue with Classlink
Continue with Clever
or continue with
Microsoft
%20(1).png)
Apple
Others
Already have an account?
Similar Resources on Wayground

12 questions
Trees and Forest Vocabulary
Flashcard
•
6th Grade
6 questions
Belongings Movement
Flashcard
•
KG
8 questions
CHILDREN 2 (1ST CLASS)
Flashcard
•
KG
10 questions
Year 7 Textiles quiz
Flashcard
•
6th Grade
10 questions
Countries and nationalities
Flashcard
•
5th Grade
10 questions
Boon Wurrung words
Flashcard
•
7th Grade
12 questions
Yr7 Scratch key terms - flashcards
Flashcard
•
6th Grade
12 questions
Organic 2 Exam 4 Review
Flashcard
•
KG
Popular Resources on Wayground
7 questions
History of Valentine's Day
Interactive video
•
4th Grade
15 questions
Fractions on a Number Line
Quiz
•
3rd Grade
20 questions
Equivalent Fractions
Quiz
•
3rd Grade
25 questions
Multiplication Facts
Quiz
•
5th Grade
22 questions
fractions
Quiz
•
3rd Grade
15 questions
Valentine's Day Trivia
Quiz
•
3rd Grade
20 questions
Main Idea and Details
Quiz
•
5th Grade
20 questions
Context Clues
Quiz
•
6th Grade
Discover more resources for Mathematics
20 questions
Writing Algebraic Expressions
Quiz
•
6th Grade
20 questions
Ratios/Rates and Unit Rates
Quiz
•
6th Grade
20 questions
Graphing Inequalities on a Number Line
Quiz
•
6th - 9th Grade
20 questions
One Step Equations
Quiz
•
6th Grade
10 questions
Solving One Step Inequalities
Quiz
•
6th Grade
15 questions
Equivalent Ratios
Quiz
•
6th Grade
16 questions
2022 Winter Olympics Medal Table
Passage
•
6th - 8th Grade
20 questions
Writing Ratios & Identifying Equivalent Ratios
Quiz
•
6th Grade