Normal Distribution
Flashcard
•
Mathematics
•
11th - 12th Grade
•
Practice Problem
•
Hard
Standards-aligned

Wayground Content
FREE Resource
Student preview

15 questions
Show all answers
1.
FLASHCARD QUESTION
Front
What is a normal distribution?
Back
A normal distribution is a continuous probability distribution characterized by a symmetric bell-shaped curve, where most of the observations cluster around the central peak and probabilities for values further away from the mean taper off equally in both directions.
2.
FLASHCARD QUESTION
Front
What are the mean and standard deviation in a normal distribution?
Back
The mean is the average of all data points, and the standard deviation measures the dispersion or spread of the data points around the mean.
3.
FLASHCARD QUESTION
Front
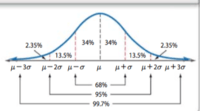
What is the empirical rule (68-95-99.7 rule)?
Back
The empirical rule states that for a normal distribution: 68% of data falls within one standard deviation of the mean, 95% falls within two standard deviations, and 99.7% falls within three standard deviations.
Tags
CCSS.HSS.ID.A.4
4.
FLASHCARD QUESTION
Front
How do you calculate a z-score?
Back
A z-score is calculated using the formula: z = (X - μ) / σ, where X is the value, μ is the mean, and σ is the standard deviation.
5.
FLASHCARD QUESTION
Front
What does a z-score represent?
Back
A z-score represents the number of standard deviations a data point is from the mean. A positive z-score indicates the value is above the mean, while a negative z-score indicates it is below the mean.
6.
FLASHCARD QUESTION
Front
What is the significance of the area under the normal curve?
Back
The area under the normal curve represents the probability of a random variable falling within a particular range of values.
Tags
CCSS.HSS.ID.A.4
7.
FLASHCARD QUESTION
Front
What is the relationship between z-scores and percentiles?
Back
Z-scores can be used to determine percentiles, which indicate the percentage of data points that fall below a particular value in a normal distribution.
Tags
CCSS.HSS.ID.A.4
Access all questions and much more by creating a free account
Create resources
Host any resource
Get auto-graded reports
Continue with Google

Continue with Email
Continue with Classlink
Continue with Clever
or continue with
Microsoft
%20(1).png)
Apple
Others
Already have an account?
Similar Resources on Wayground

12 questions
Descriptive adjectives for Home and Furniture
Flashcard
•
10th Grade - University
15 questions
7517 01 Programming Basics
Flashcard
•
10th Grade - University
15 questions
Muscle Contractions
Flashcard
•
12th Grade - University
15 questions
ESL Tutorial Review - Numbers, Days, Months, Years
Flashcard
•
12th Grade - University
12 questions
Organic 2 Exam 4 Review
Flashcard
•
KG
8 questions
CHILDREN 2 (1ST CLASS)
Flashcard
•
KG
11 questions
7517 05 Structured Programming
Flashcard
•
10th Grade - University
8 questions
Unit 3.7 Firm's costs, Revenue & Objective
Flashcard
•
11th Grade
Popular Resources on Wayground
15 questions
Fractions on a Number Line
Quiz
•
3rd Grade
20 questions
Equivalent Fractions
Quiz
•
3rd Grade
25 questions
Multiplication Facts
Quiz
•
5th Grade
22 questions
fractions
Quiz
•
3rd Grade
20 questions
Main Idea and Details
Quiz
•
5th Grade
20 questions
Context Clues
Quiz
•
6th Grade
15 questions
Equivalent Fractions
Quiz
•
4th Grade
20 questions
Figurative Language Review
Quiz
•
6th Grade
Discover more resources for Mathematics
12 questions
Add and Subtract Polynomials
Quiz
•
9th - 12th Grade
13 questions
Model Exponential Growth and Decay Scenarios
Quiz
•
9th - 12th Grade
27 questions
7.2.3 Quadrilateral Properties
Quiz
•
9th - 12th Grade
10 questions
Key Features of Quadratic Functions
Interactive video
•
8th - 12th Grade
11 questions
Exponent Quotient Rules A1 U7
Quiz
•
9th - 12th Grade
18 questions
Integer Operations
Quiz
•
5th - 12th Grade
15 questions
Exponential Growth and Decay Word Problems
Quiz
•
9th - 12th Grade
10 questions
complementary and Supplementary angles
Quiz
•
9th - 12th Grade