
Multiple representations 7.4A, 7.7A

Flashcard
•
Mathematics
•
7th Grade
•
Practice Problem
•
Hard
+10
Standards-aligned

Wayground Content
FREE Resource
Student preview

15 questions
Show all answers
1.
FLASHCARD QUESTION
Front
What is a table in mathematics?
Back
A table is a systematic arrangement of data, usually in rows and columns, that shows the relationship between different variables.
Tags
CCSS.1.MD.C.4
2.
FLASHCARD QUESTION
Front
What is a graph in mathematics?
Back
A graph is a visual representation of data that shows the relationship between two or more variables, typically using points, lines, or bars.
3.
FLASHCARD QUESTION
Front
What does 'rate of change' mean?
Back
Rate of change refers to how much a quantity changes in relation to another quantity, often expressed as a ratio or a slope in a graph.
Tags
CCSS.8.F.B.4
CCSS.HSF.IF.B.6
4.
FLASHCARD QUESTION
Front
How do you write an equation for a linear relationship?
Back
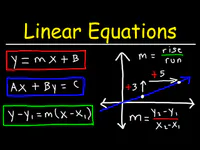
A linear relationship can be expressed in the form y = mx + b, where m is the slope and b is the y-intercept.
Tags
CCSS.8.F.B.4
CCSS.HSF.LE.A.2
5.
FLASHCARD QUESTION
Front
What is the slope of a line?
Back
The slope of a line is a measure of its steepness, calculated as the change in y divided by the change in x (rise/run).
Tags
CCSS.8.EE.B.5
6.
FLASHCARD QUESTION
Front
What does the y-intercept represent in a graph?
Back
The y-intercept is the point where the line crosses the y-axis, representing the value of y when x is zero.
7.
FLASHCARD QUESTION
Front
How can you determine the total cost from a word problem?
Back
To determine the total cost, identify the fixed costs and variable costs, then create an equation that combines them.
Tags
CCSS.8.F.B.4
CCSS.HSF.LE.A.2
Access all questions and much more by creating a free account
Create resources
Host any resource
Get auto-graded reports

Continue with Google

Continue with Email

Continue with Classlink

Continue with Clever
or continue with

Microsoft
%20(1).png)
Apple

Others
Already have an account?

