Search Header Logo
  1. Resource Library
  2. Math
  3. Data And Graphing
  4. ...
  5. [8] 2.3 Interpreting Graphs
[8] 2.3 Interpreting Graphs

[8] 2.3 Interpreting Graphs

Assessment

Presentation

Mathematics

8th Grade

Easy

CCSS
HSF.IF.B.4, 5.G.A.2, 8.EE.B.5

+4

Standards-aligned

Created by

Katie Sylvia

Used 2+ times

FREE Resource

2 Slides • 30 Questions

1

[8] 2.3 Interpreting Graphs

Slide image

2

3

Multiple Choice

Question image

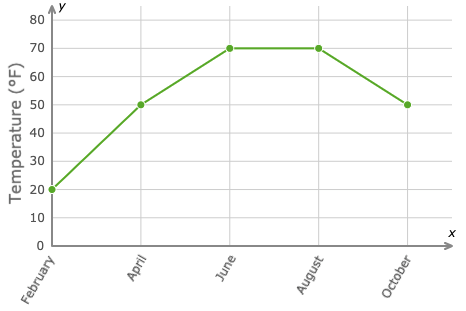
What month was the coldest?

1

February

2

April

3

August

4

October

4

Multiple Choice

Question image

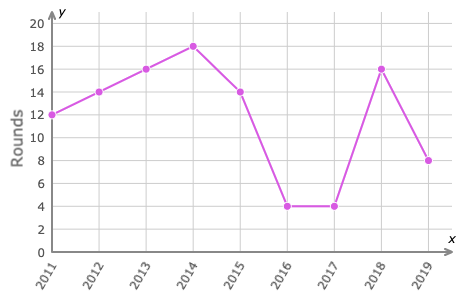
What year had the most spelling bee rounds?

1

2012

2

2014

3

2016

4

2018

5

Multiple Choice

Question image

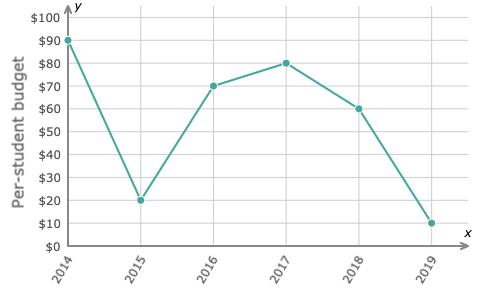
How much did the budget decrease between 2017 and 2018?

1

$70.00/student

2

$50.00/student

3

$20.00/student

6

Multiple Choice

Question image
Describe the bus’s motion from A-B
1
A)The bus is speeding up
2
 B)The bus's speed is remaining constant
3
 C)The Bus is stopped
4
 D)The bus is beginning to slow down

7

Multiple Choice

Question image

Describe the bus’s motion from B-C

1

A)The bus is speeding up

2

B)The bus's speed is remaining constant

3

C)The Bus is stopped

4

D)The bus is beginning to slow down

8

Multiple Choice

Question image
What was the speed of the bus from point A-B
1
A)12 m/s
2
 B)20 m/s 
3
 C)10 m/s 
4
 D)The bus is stopped, so its speed must be zero

9

Multiple Choice

Question image
How much does it cost to have your lawn mowed for 2 hours?
1
$16
2
$17
3
$18
4
$19

10

Multiple Choice

Question image

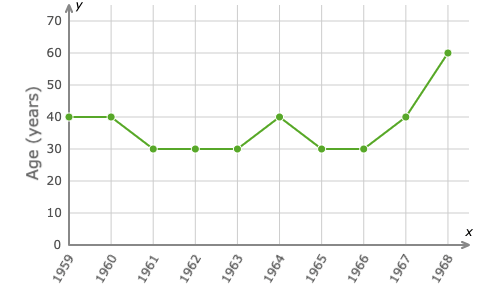
Between what two years did the average age increase by 20?
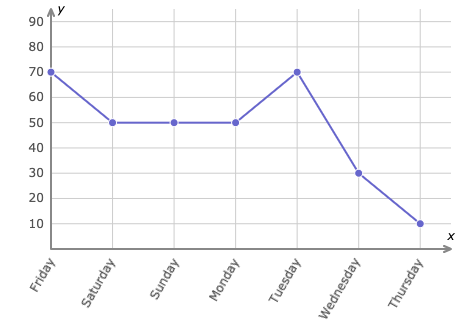
1

1967-1968

2

1960-1961

3

1962-1963

4

1966-1967

11

Multiple Choice

Question image

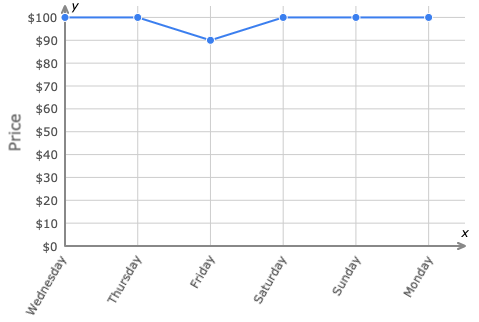
What day did the stock price fall $10.00?

1

Wednesday

2

Friday

3

Sunday

4

Monday

12

Multiple Select

Question image

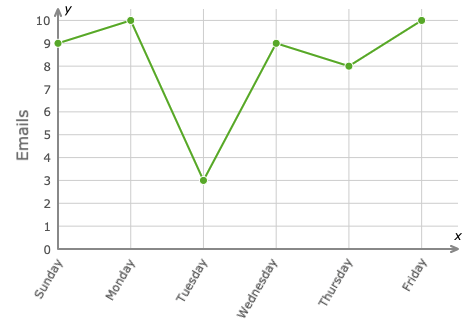
What days were 9 emails received?

1

Sunday

2

Tuesday

3

Wednesday

4

Friday

13

Multiple Choice

Question image

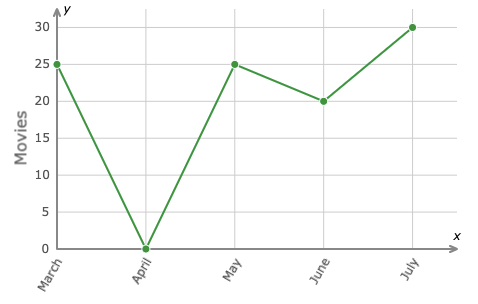
How many more movies were seen in March than April?

1

0

2

5

3

10

4

25

14

Multiple Choice

Question image

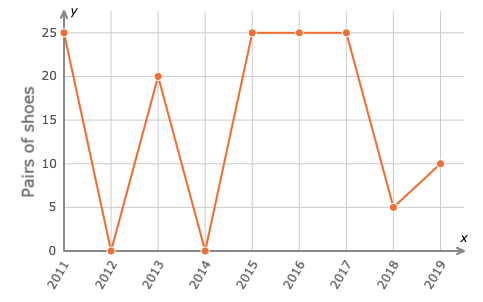
How many pairs of shoes did Heidi buy in 2017?

1

0

2

10

3

20

4

25

15

Multiple Choice

Question image

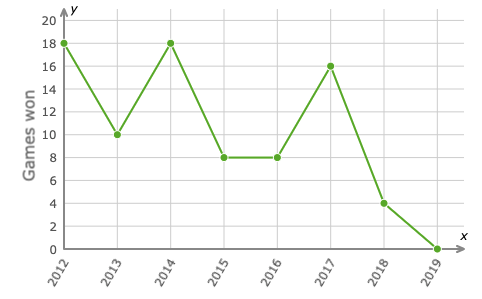
How many more games were won in 2014 than 2015?

1

4

2

8

3

10

4

12

16

Multiple Choice

Question image

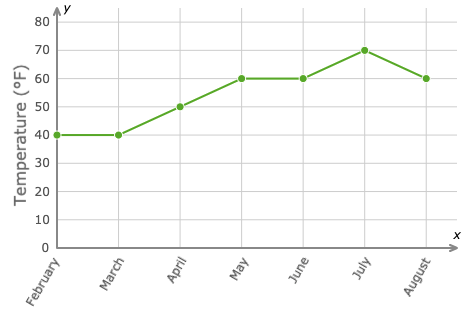
How much warmer was the temperature in April than March?

1

10 degrees

2

20 degrees

3

30 degrees

4

40 degrees

17

Multiple Choice

Question image

What day was the least amount of time spent on homework?

1

Friday

2

Sunday

3

Tuesday

4

Thursday

18

Multiple Select

Question image

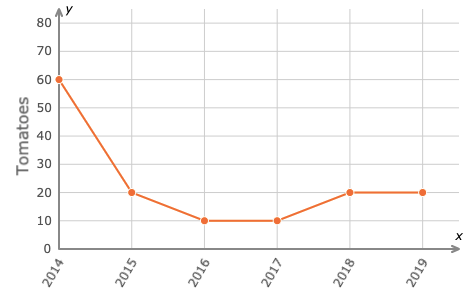
What years were 10 tomatoes grown?

1

2016

2

2017

3

2018

4

2019

19

Multiple Select

Question image

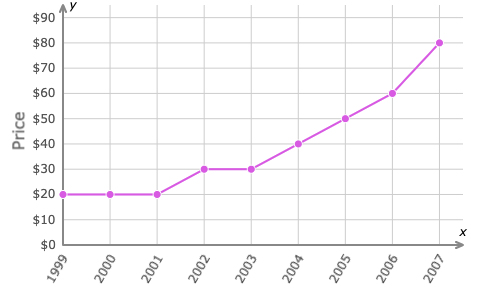
What years was the price $30.00?

1

2001

2

2002

3

2003

4

2004

20

Multiple Choice

Question image

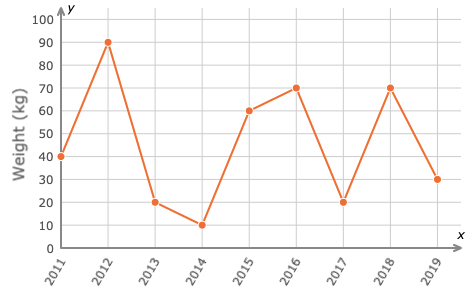
What was the average weight in 2018?

1

90 kg

2

70 kg

3

40 kg

4

30 kg

21

Multiple Choice

Question image

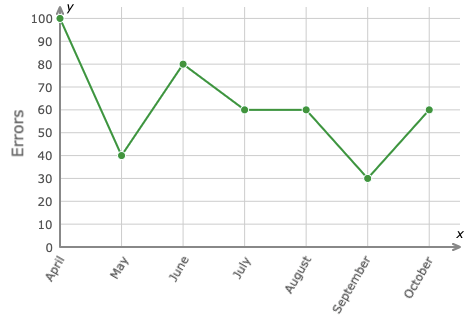
How many errors were made in June?

1

100

2

80

3

60

4

40

22

Multiple Choice

Question image

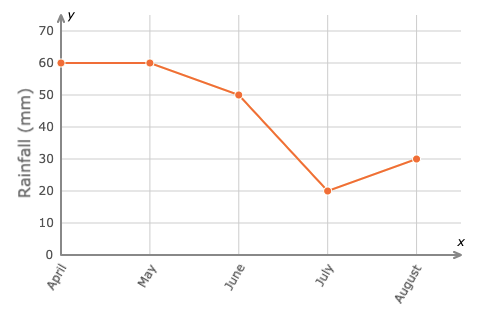
What is the rainfall total for May?

1

60 mm

2

50 mm

3

30 mm

4

20 mm

23

Multiple Choice

Question image

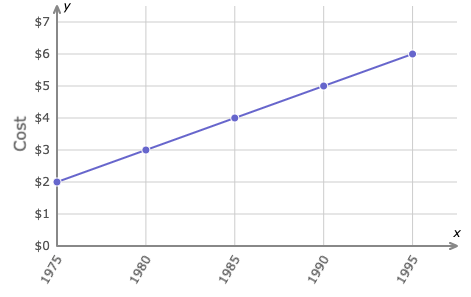
What year did a book cost $4.00?

1

1980

2

1985

3

1990

24

Multiple Choice

Question image

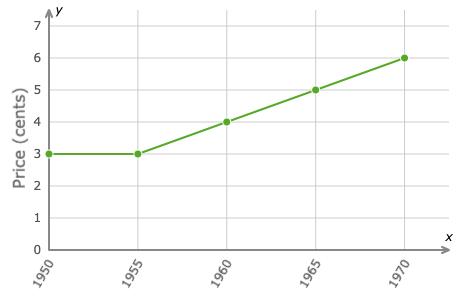
How much was a stamp in 1965?

1

3 cents

2

4 cents

3

5 cents

4

6 cents

25

Multiple Choice

Question image

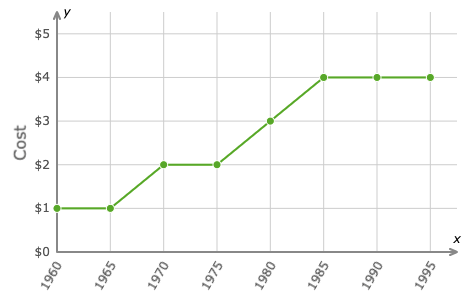
What year did a ticket cost $3.00?

1

1960

2

1970

3

1980

4

1990

26

Multiple Choice

Question image

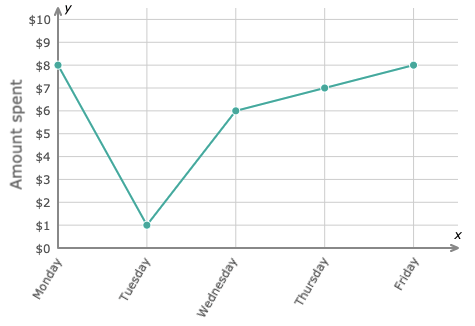
How much money was spent on Thursday?

1

1

2

6

3

7

4

8

27

Multiple Choice

Question image
Select the graph that best illustrates the story.
1
a
2
b
3
c
4
d

28

Multiple Choice

Question image
Select the graph that best illustrates the story.
1
a
2
b
3
c
4
d

29

Multiple Choice

Question image
Select the graph that best illustrates the story.
1
a
2
b
3
c
4
d

30

Multiple Choice

Question image
Select the graph that best illustrates the story.
1
a
2
b
3
c
4
d

31

Multiple Choice

Question image
Select the graph that best illustrates the story.
1
a
2
b
3
c
4
d

32

Multiple Choice

Question image
Choose the best graph that describes the statement.
1
A
2
B
3
C
4
D

[8] 2.3 Interpreting Graphs

Slide image

Show answer

Auto Play

Slide 1 / 32

SLIDE