Search Header Logo
  1. Resource Library
  2. Math
  3. Probability And Statistics
  4. Shapes Of Distributions
  5. Distributions & Their Shapes
Distributions & Their Shapes

Distributions & Their Shapes

Assessment

Presentation

Mathematics

9th Grade

Practice Problem

Medium

CCSS
6.SP.B.5C

Standards-aligned

Created by

Teri Salter

Used 44+ times

FREE Resource

3 Slides • 10 Questions

1

Distributions & Their Shapes

Dot Plots, Histograms, & Box Plots

media

2

Standards: S.ID.1,2,3

  • Learning Target: I CAN successfully construct dot plots, box plots, and histograms

3

For questions 1 & 2, determine the best way to display the data--dot plot, box plot, or histogram.

4

Multiple Choice

1.) Rob wanted to determine the salt content in canned vegetables, so he went to the local grocery store and recorded his data.

1

dot plot

2

histogram

3

box plot

5

Multiple Choice

2.) Lily conducted a school survey to determine how often during a month that teachers gave homework assignments.

1

dot plot

2

histogram

3

box plot

6

Multiple Choice

3.) Given the following data set, determine Q1:


81, 85, 86, 88, 89, 92, 93, 97, 100

1

81

2

85.5

3

89

4

95

7

Multiple Choice

Question image

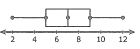
4.)Which of the following best describes the shape of the distribution?

1

SKEWED LEFT

2

SKEWED RIGHT

3

UNIFORM

4

SYMMETRICAL

8

Multiple Choice

Question image

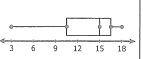
5.)Which of the following best describes the shape of the distribution?

1

SKEWED LEFT

2

SKEWED RIGHT

3

UNIFORM

4

SYMMETRICAL

9

Multiple Choice

Question image

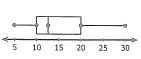
6.)Which of the following best describes the shape of the distribution?

1

SKEWED LEFT

2

SKEWED RIGHT

3

UNIFORM

4

SYMMETRICAL

10

Multiple Choice

Question image

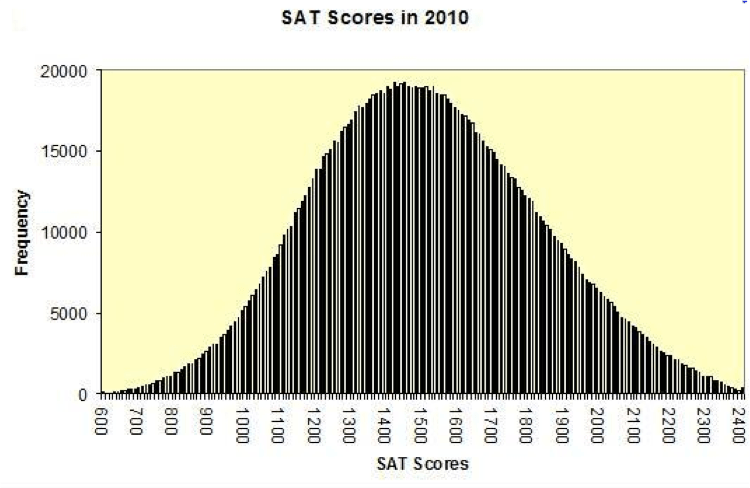
7.)Describe the distribution of the histogram:

1

Left Skewed

2

Symmetrical

3

Right Skewed

4

Uniform

11

Multiple Choice

Question image

8.)What is the shape of the distribution?

1

Skewed Left

2

Skewed Right

3

Symmetric

4

Bimodal

12

Multiple Choice

Question image

9.)Type of Data arrangement

1

Symmetrical

2

Hairline

3

Skewed Right

4

Skewed Left

13

Multiple Choice

Question image

10.)Which of the following best describes the shape of the distribution?

1

SKEWED LEFT

2

SKEWED RIGHT

3

SYMMETRICAL

Distributions & Their Shapes

Dot Plots, Histograms, & Box Plots

media

Show answer

Auto Play

Slide 1 / 13

SLIDE