Search Header Logo
Position - Time Graph

Position - Time Graph

Assessment

Presentation

Physics

9th Grade

Practice Problem

Medium

NGSS.MS-PS3-1, CCSS.HSF.IF.B.4, CCSS.8.EE.B.5

Standards-aligned

Created by

Olamide Gbenga

Used 35+ times

FREE Resource

15 Slides • 8 Questions

1

Position - Time Graph

Page 53

Slide image

2

Poll

Click on the one that applies to you

Present

Absent

3

Slide image

4

Lesson Objective

At the end of the lesson, students will be able to

  • Plot position-time graphs.
  • Interpret position-time graphs to determine the velocity of an object

5

Slide image

6

Slide image

7

Slide image

8

Multiple Choice

On a position-time graph, the position (distance) is plotted on the ____ axis. 
1
x
2
y

9

Slide image

10

Slide image

11

Slide image

12

Position - Time Graphs

First we make up a position time table

Slide image

13

Multiple Choice

Question image

A position-time graph of an athlete winning the 100-m run is shown. Estimate the time taken by the athlete to reach 65 m.

1

6.0 s

2

6.5 s

3

5.5 s

4

7.0 s

14

Multiple Choice

Question image

A position-time graph of an athlete winning the 100-m run is shown. What was the instantaneous position of the athlete at 2.5 s?

1

15 m

2

20 m

3

25 m

4

30 m

15

Multiple Choice

Question image

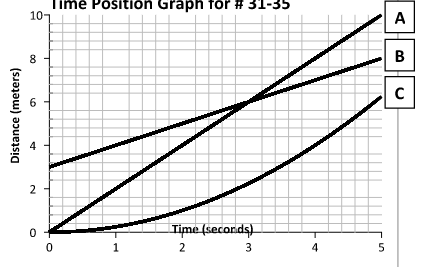
from 3rd second to 5th second, the object is

1

moving at a constant speed

2

speeding up

3

not moving

4

slowing down

16

Multiple Choice

Question image
Which runner had a head start?
1
A
2
B
3
C

17

Microsoft Teams

Another Example

18

Multiple Choice

Question image

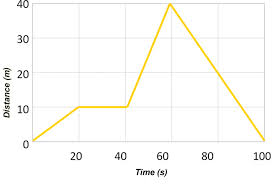
What is the displacement of the object from the 40 to the 60 second

1

20 m

2

30 m

3

60 m

4

100 m

19

Multiple Choice

Question image

What is the distance travelled by the object from 0 to 8 seconds

1

0 s to 2 s

2

2 s to 4 s

3

4 s to 5 s

20

Slide image

21

Slide image

22

Slide image

23

Slide image

Position - Time Graph

Page 53

Slide image

Show answer

Auto Play

Slide 1 / 23

SLIDE