Search Header Logo
  1. Resource Library
  2. Math
  3. Data And Graphing
  4. Stem And Leaf Plot
  5. Histogram & Stem & Leaf Review
Histogram & Stem & Leaf Review

Histogram & Stem & Leaf Review

Assessment

Presentation

Mathematics

6th Grade

Practice Problem

Medium

CCSS
6.SP.B.4, 6.SP.A.2, 2.MD.D.9

+4

Standards-aligned

Created by

Kimberly BRENDLE

Used 140+ times

FREE Resource

5 Slides • 15 Questions

1

Histogram & Stem & Leaf Review

Let's review these types of graphs to see if we are ready for the test!

Slide image

2

Poll

Do you feel confident working with and reading Histograms?

Yes definitely

Yes kind of

No I have questions

What is a Histogram?

3

Poll

Do you feel confident working with a Stem and Leaf Plot?

Yes definitely

Yes kind of

No I have questions

What is a Stem And Leaf Plot?

4

What is a Histogram?

  • A Histogram is a graph that represents a large data set

  • The data has a wide range (it is very spread out)

  • There is not much repetition in the data

  • The bars in a histogram are called bins.

  • Each bin represents a range of data like 0-4, 5-9, 10-14 etc.

  • No individual data points can be determined from a histogram

5

Fill in the Blank

Question image

This type of graph is a _.

6

Fill in the Blank

Question image

The numbers on the horizontal axis tell you _.

7

Multiple Choice

Question image

The numbers on the vertical axis tell you_.

1

What time it is.

2

How many frogs jumped each distance.

3

How many frogs were in the pond.

4

How many frogs live at Mrs. Brendle's house.

8

Fill in the Blank

Question image

- frogs jumped 220 ft or more.

9

Slide image


10

Slide image

11

Multiple Choice

Question image

How many cities have temperatures between 70 degrees and 99 degrees? Remember to look at ALL the bars with temperatures from 70 degrees to 99 degrees.

1

44

2

34

3

26

4

62

12

Stem and Leaf Plot

  • Used when data is spread out and there is not much repetition in the data

  • The Leaf only shows the ones place

  • The Stem can show the tens and hundreds place values

  • Every data point can be seen on a Stem and Leaf Plot

13

Multiple Choice

Question image
How many scores are listed in this Stem and Leaf Plot?
1
3
2
6
3
9
4
18

14

Multiple Choice

Question image

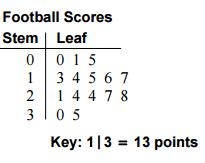
How many students scored more than 80%?

1

2

2

13

3

6

4

7

15

Multiple Choice

Question image

In how many games did the team score more than 20 points?

1

8

2

7

3

10

4

9

16

Multiple Choice

Question image
What is the highest quiz grade in the stem and leaf plot?
1
9
2
26
3
92
4
96

17

Multiple Choice

Question image

How many students took the quiz?

1

20

2

18

3

16

4

14

18

Multiple Choice

Question image

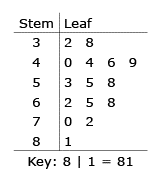
A florist records the amount of money he spent on gasoline each week to deliver orders. The list shows the data for 16 weeks.

32, 38, 40, 44, 44, 46, 49, 53, 55, 58, 62, 65, 68, 70, 72, 81

He put the data in a stem-and-leaf plot. What number did he leave out of the stem-and-leaf plot?

1

32

2

44

3

65

4

84

19

Poll

Do you feel confident working with and reading Histograms?

Yes definitely

Yes kind of

No I have questions

What is a Histogram?

20

Poll

Do you feel confident working with a Stem and Leaf Plot?

Yes definitely

Yes kind of

No I have questions

What is a Stem And Leaf Plot?

Histogram & Stem & Leaf Review

Let's review these types of graphs to see if we are ready for the test!

Slide image

Show answer

Auto Play

Slide 1 / 20

SLIDE