
Proportional Relationship: Tables and Graphs
Presentation
•
Mathematics
•
6th - 8th Grade
•
Medium
+1
Standards-aligned

Stephanie White
Used 585+ times
FREE Resource
7 Slides • 11 Questions
1
Proportional Relationship: Tables and Graphs

2
3
Proportional Relationship
Straight line
Goes through (0,0)

4
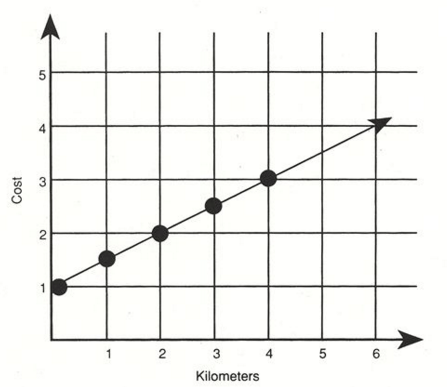
Not Proportional
This has a straight line but it does NOT go through the point (0,0)

5
Multiple Choice

6
Multiple Choice

7
Multiple Choice

8
Multiple Choice

Is the graph proportional or non proportional?
9
Multiple Choice
10
Multiple Choice

11
12
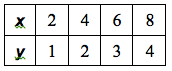
Proportional
1) The same number multiplied by every x will give you the y value
2) The change of y over the change of x will be the same throughout the table

13
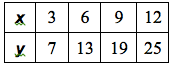
Not Proportional
1) Your coordinate pair will be (0,y) where y does NOT equal 0.

14
Multiple Choice
15
Multiple Choice
16
Multiple Choice

17
Multiple Choice

18
Multiple Choice

Does the table show a proportional relationship?
Proportional Relationship: Tables and Graphs
Show answer
Auto Play
Slide 1 / 18
SLIDE
