

5.3 Dot Plots
Presentation
•
Mathematics
•
11th - 12th Grade
•
Medium
+2
Standards-aligned
Darrin Dailey
Used 346+ times
FREE Resource
10 Slides • 10 Questions
1
Lesson 5.3 Dot Plots
Algebra 2

2
Dot Plots
Dot plots are a convenient way to look at how data is distributed across its values. You can see which values show up most often and how spread out the data is.
Dot plots are best used with numerical data all rounded the same. Whole numbers are most convenient, but decimals can work, too.
3
Dot Plots
Each dot in a dot plot is a data point plotted along a horizontal axis. Duplicate values are stacked. In this plot, there are 50 data values represented. The value 6 is present 4 times in the set.
4
Please answer the next three questions
Thank you!
5
Multiple Choice
What is the highest score in the class?
88%
100%
13
98%
6
Multiple Choice
How many students spent 7 hours doing homework that week?
1
3
5
6
7
Multiple Choice
How many students read no books (zero) last summer?
6
1
4
3
8
Dot Plots
You can also count across multiple columns to answer questions about ranges of responses. For example:
How many times did an even number get picked? Count up the even columns.
9
Please answer the next six questions
Thanks again!
10
Multiple Choice
How many people have 4 or more pets?
8
3
6
4
11
Multiple Choice
How many students scored 93% or less?
6
16
14
13
12
Multiple Choice
How many students scored between 95 and 100?
6
6
9
14
13
Multiple Choice
How many students received a score in the 80's?
2
10
14
27
14
Multiple Choice
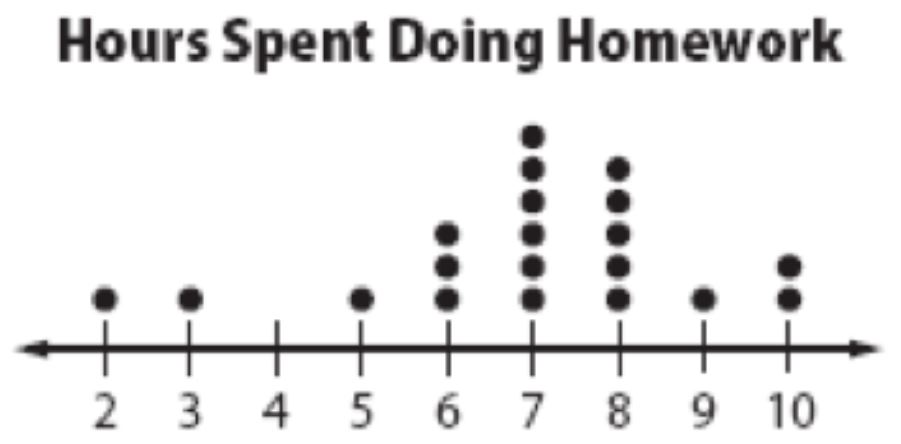
What is the greatest amount of time a student spent doing his homework?
2 hours
1 hour
6 hours
10 hours
15
Multiple Choice
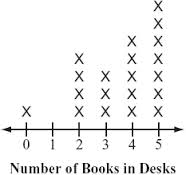
How many people have two or less books in their desk?
4
5
6
7
16
Building a Dot Plot
Building a dot plot is just a matter of plotting data points on a number line and stacking any duplicates. It's important that your number line be evenly spaced, so it's alright for there to be gaps.
17
Building a Dot Plot
The data set doesn't even have to be ordered. You just create a number line that will fit all the data and place a dot above the number for each value in the data set.
18
Last Question! Choose the dot plot that best matches the data.
Almost done!
19
Multiple Choice
20
Thank you for watching
You are now dot plot experts!
Lesson 5.3 Dot Plots
Algebra 2

Show answer
Auto Play
Slide 1 / 20
SLIDE
Similar Resources on Wayground
16 questions
Properties of Parallelograms
Presentation
•
10th - 12th Grade
14 questions
1-3 Data Collection and Sampling Techniques
Presentation
•
11th Grade - University
14 questions
PERGESERAN / TRANSLASI
Presentation
•
11th Grade
17 questions
Significant Figures
Presentation
•
11th Grade
17 questions
Compound Probability
Presentation
•
11th - 12th Grade
15 questions
7.3: Segments in Circles
Presentation
•
10th - 12th Grade
12 questions
Taxes
Presentation
•
11th - 12th Grade
15 questions
Quadratic Functions
Presentation
•
10th - 12th Grade
Popular Resources on Wayground
16 questions
Grade 3 Simulation Assessment 2
Quiz
•
3rd Grade
19 questions
HCS Grade 5 Simulation Assessment_1 2526sy
Quiz
•
5th Grade
10 questions
Cinco de Mayo Trivia Questions
Interactive video
•
3rd - 5th Grade
17 questions
HCS Grade 4 Simulation Assessment_2 2526sy
Quiz
•
4th Grade
24 questions
HCS Grade 5 Simulation Assessment_2 2526sy
Quiz
•
5th Grade
13 questions
Cinco de mayo
Interactive video
•
6th - 8th Grade
20 questions
Math Review
Quiz
•
3rd Grade
30 questions
GVMS House Trivia 2026
Quiz
•
6th - 8th Grade
Discover more resources for Mathematics
5 questions
A.EI.1-3 Quizizz Day 1
Quiz
•
9th - 12th Grade
5 questions
A.EI.1-3 Quizizz Day 2
Quiz
•
9th - 12th Grade
5 questions
A.EI.1-3 Quizizz Day 4
Quiz
•
9th - 12th Grade
5 questions
G.PC/DF Quizizz Day 2
Quiz
•
9th - 12th Grade
5 questions
A.F/ST Quizizz Day 5
Quiz
•
9th - 12th Grade
5 questions
G.PC/DF Quizizz Day 1
Quiz
•
9th - 12th Grade
5 questions
A.EI.1-3 Quizizz Day 3
Quiz
•
9th - 12th Grade
5 questions
G.TR.1-4 Quizizz Day 1
Quiz
•
9th - 12th Grade