
Kinematic Graph Review
Presentation
•
Physics
•
10th - 12th Grade
•
Practice Problem
•
Medium
•
NGSS.MS-PS3-1, CCSS.HSF.IF.B.4, NGSS.HS-PS2-1
Standards-aligned

Katherine Johnson
Used 35+ times
FREE Resource
5 Slides • 8 Questions
1

2
3

4

5

6
Multiple Choice

The graph shows Ashley riding her bike to Maria's house.
What was occurring from point B to point C?
What was occurring from point B to point C?
7
Multiple Choice
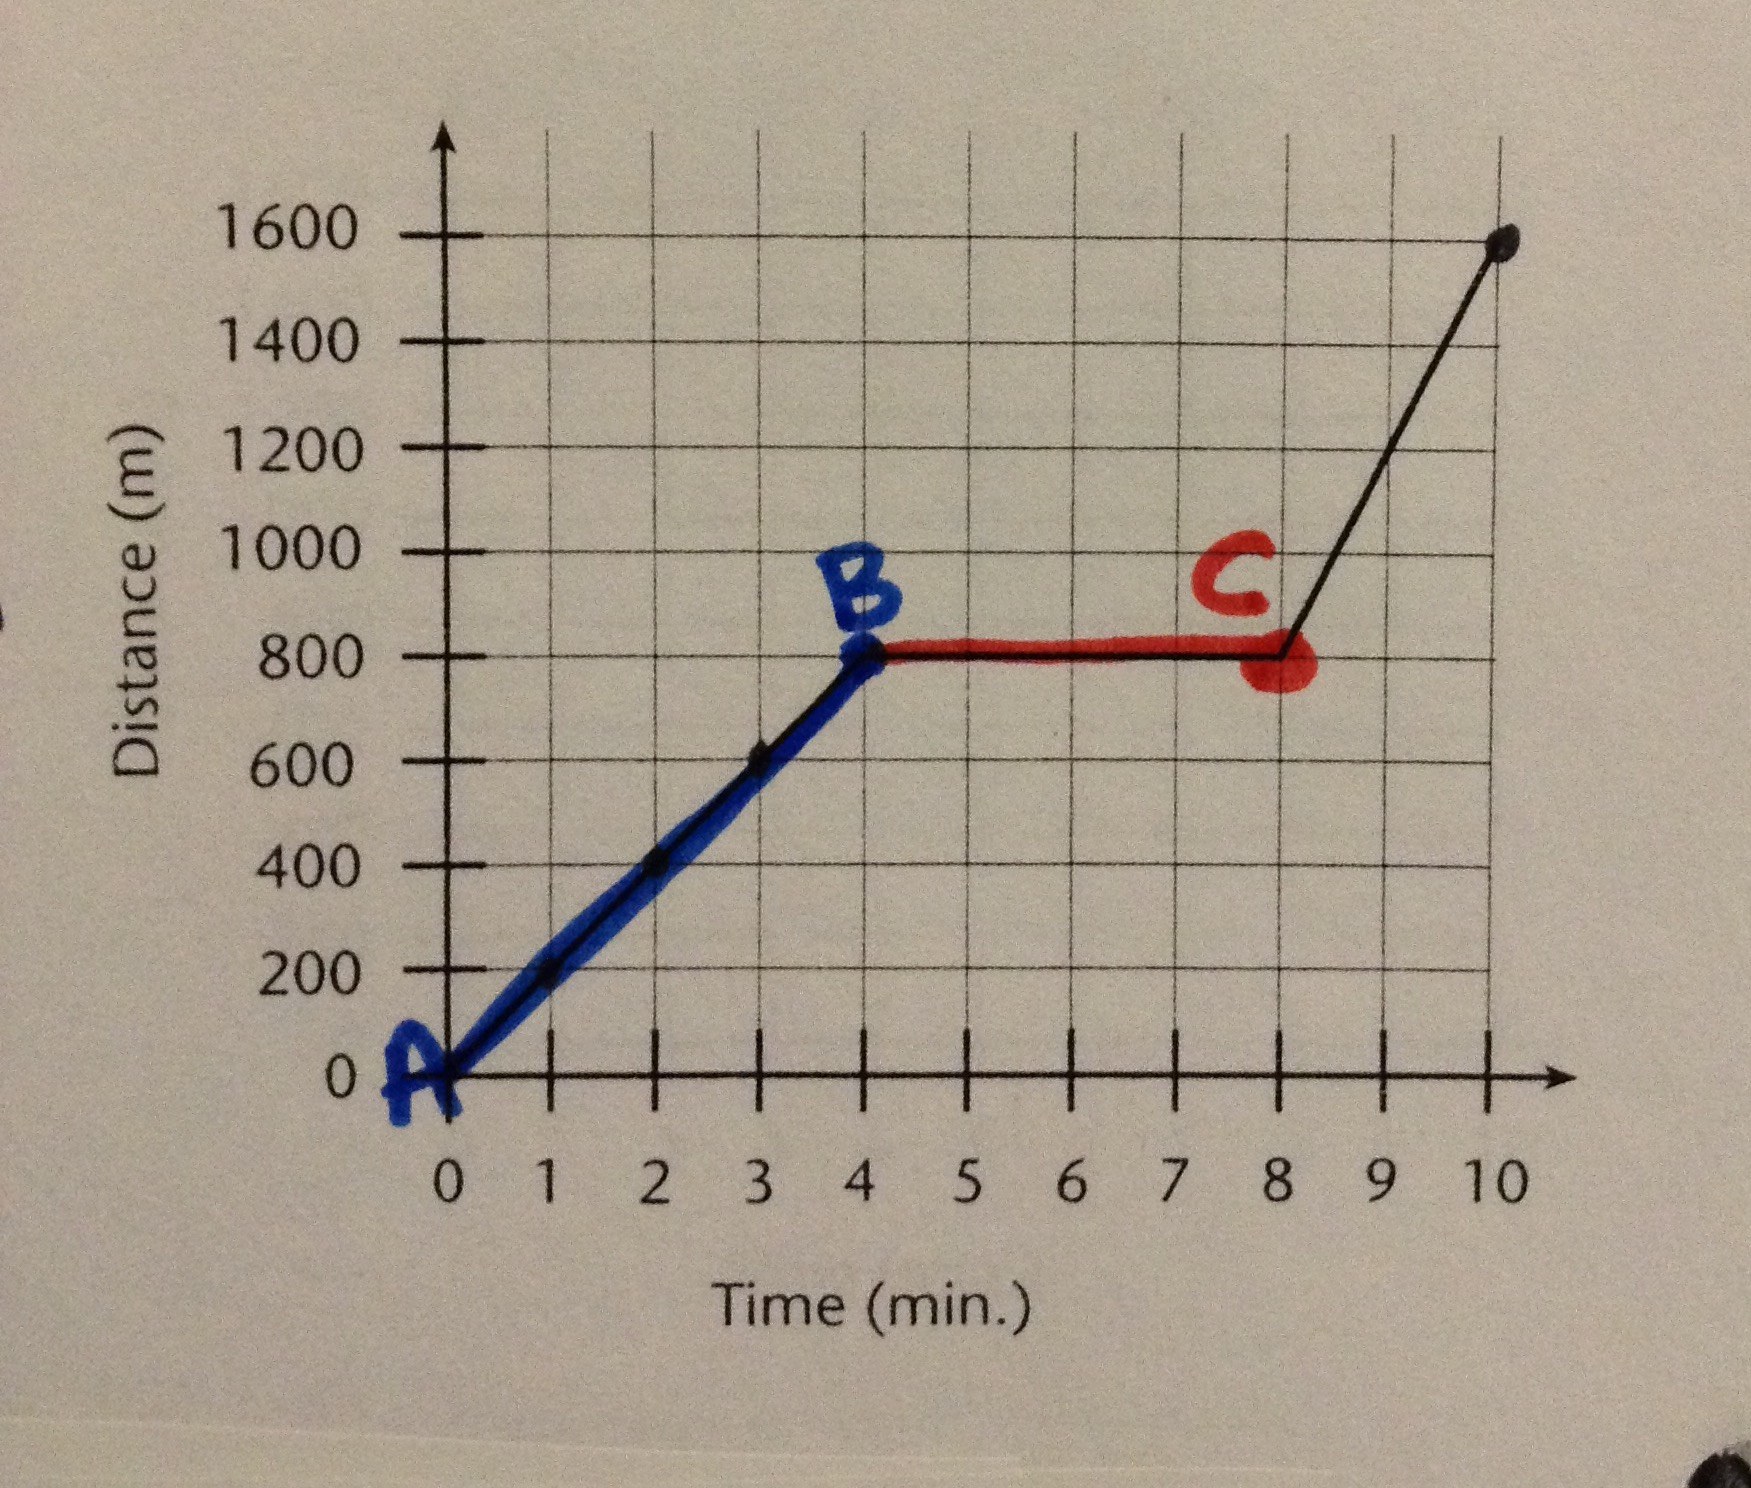
The graph shows Ashley riding her bike to Maria's house.
What is occurring from point A to point B?
What is occurring from point A to point B?
8
Multiple Choice

At 60 seconds, how far had this object traveled?
9
Multiple Choice

What is happening between 2 and 3 seconds?
10
Multiple Choice

What is happening between 3 seconds and 4 seconds?
11
Multiple Choice

What is happening between 4 and 5 seconds?
12
Multiple Choice

Calculate the acceleration for segment A. (Remember slope for a v-t graph is acceleration.)
13
Multiple Choice

A person walking along a straight line moves such that her velocity as a function of time can be represented by the graph above. At what time does the person have the same position as she had at time t = 0?
Show answer
Auto Play
Slide 1 / 13
SLIDE
