
data year 3
Presentation
•
Mathematics
•
3rd Grade
•
Practice Problem
•
Medium
•
CCSS
3.MD.B.3, 3.OA.D.8, 2.MD.D.9
+16
Standards-aligned

CIKGU NOR HAPIZAH
Used 83+ times
FREE Resource
1 Slide • 15 Questions
1
PICTOGRAPH, BAR CHART AND PIE CHART
refer text book page 109 to 116

2
Multiple Choice

How many birds are represented by the green sector?
3
Multiple Choice
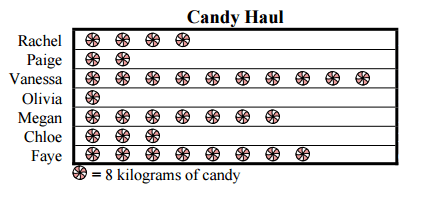
Who has the least candy?
4
Multiple Choice

What type of graph is this?
5
Multiple Choice
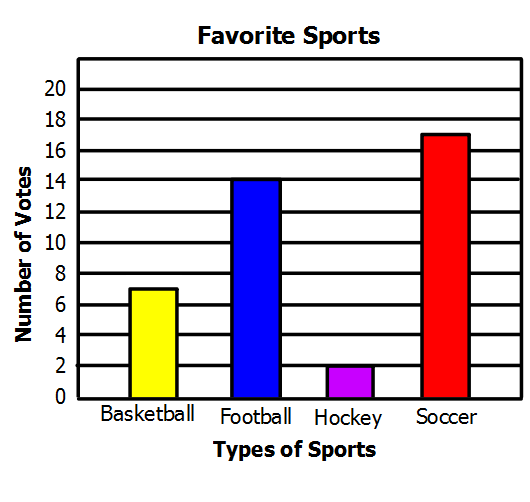
How many more students like soccer than basketball?
6
Multiple Choice
What type of graph is this?
7
Multiple Choice

Which two popsicle flavors did the students like best?
8
Multiple Choice

How many more students like orange than lemon flavored popsicles?
9
Multiple Choice

Which popsicle flavor is the students' least favorite?
10
Multiple Choice

How many students like grape flavored popsicles?
11
Multiple Choice

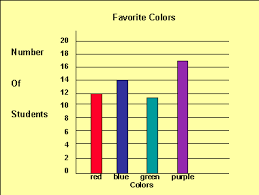
How many more people have purple for a favourite colour than red?
12
Multiple Choice
How many people voted for red as their favourite colour?
13
Multiple Choice

How many more students liked pizza than those that liked chicken and taco's?
14
Multiple Choice
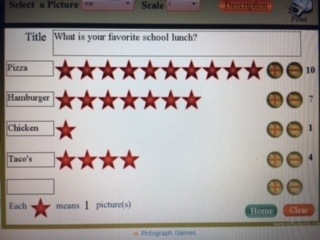
What was the favourite food?
15
Multiple Choice
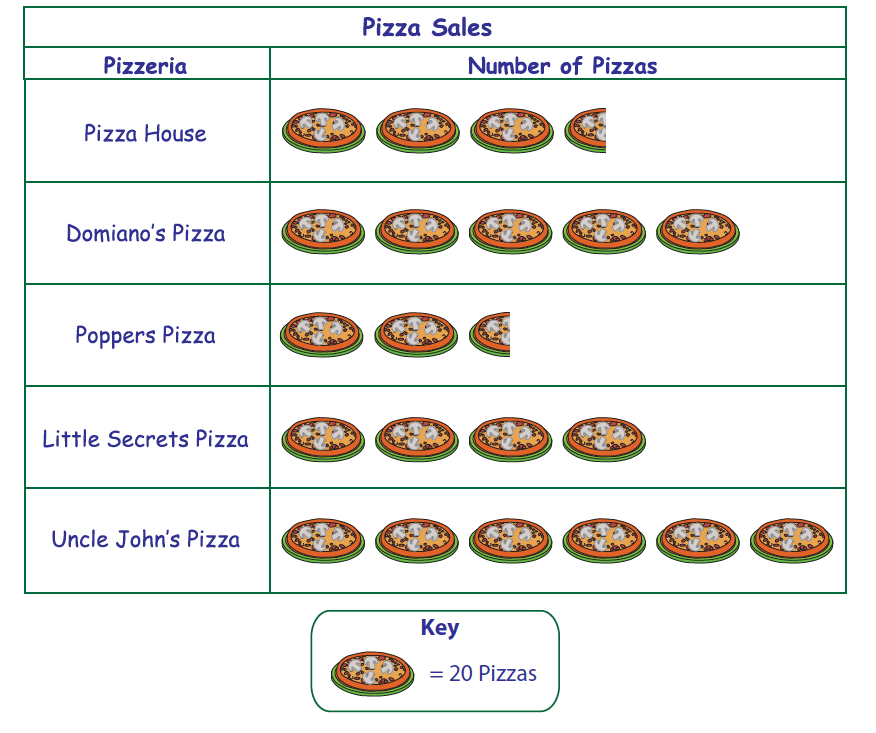
Which pizzeria has the second largest sales?
16
Multiple Choice
How many total votes were collected?
PICTOGRAPH, BAR CHART AND PIE CHART
refer text book page 109 to 116
Show answer
Auto Play
Slide 1 / 16
SLIDE
