
Correlation
Presentation
•
Mathematics
•
9th Grade
•
Practice Problem
•
Medium
•
CCSS
HSS.ID.B.5, HSS.ID.C.8, 8.SP.A.1
+1
Standards-aligned

Lauren Wisehart
Used 1K+ times
FREE Resource
4 Slides • 9 Questions
1
Correlation

2

3
Multiple Choice
4
Multiple Choice
5
Multiple Choice

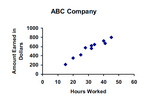
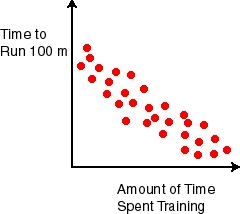
What kind of correlation?
6
Multiple Choice

What kind of correlation?
7

8
Multiple Choice
9
Multiple Choice
Estimate the correlation coefficient for this scatterplot.
10
Multiple Choice
Estimate the correlation coefficient
11

12
Multiple Choice
13
Multiple Choice
Correlation
Show answer
Auto Play
Slide 1 / 13
SLIDE
