Search Header Logo
Math Essentials Review 2

Math Essentials Review 2

Assessment

Presentation

Mathematics

9th - 12th Grade

Medium

CCSS
8.F.A.1, 6.SP.B.4, HSA.APR.A.1

+14

Standards-aligned

Created by

Mr. Grant

Used 24+ times

FREE Resource

3 Slides • 32 Questions

1

Bench Mark Review 2

Slide image

2

Multiple Choice

Question image
How many students have 1,000 or more songs on their MP3 player?
1
5
2
16
3
10
4
4

3

Multiple Choice

Is a histogram the same as a bar graph?
1
Yes, because they both use intervals.
2
No, because a histogram displays numerical data while a bar graph displays categorical data.
3
Yes, because they both use bars to display data.
4
No, because a histogram displays categorical data while a bar graph displays numerical data.

4

Multiple Choice

Question image
What type of graph is this?
1
Bar Graph
2
Line Plot
3
Pictograph
4
Tally Chart

5

Multiple Choice

Question image
Use the box plot to answer the question. 
1
15
2
18
3
24
4
30

6

Multiple Choice

(3x − 6)(7x + 7)
1
21x2 − 63x + 42
2
21x2 − 21x − 42
3
21x2 − 42
4
21x2 + 63x + 42

7

Multiple Choice

(5x+2)(x2-3x+6)
1
5x3 - 17x2 +24x +12
2
5x3 + 17x2 - 24x +12
3
5x3 - 13x2 + 24x +12
4
5x3 +13x2 - 24x - 12

8

Multiple Choice

(x + 7)(x + 9)
1
x2 + 63x + 16
2
x2 + 16x + 63
3
x2 + 79
4
x2 + 16x + 2

9

Multiple Choice

Simplify:

5(3x+2)

1

3x+10

2

15x+10

3

15x-10

4

3x-10

10

Multiple Choice

Simplify:

5(3x+2)

1

3x+10

2

15x+10

3

15x-10

4

3x-10

11

Multiple Choice

Find the mean of the numbers below:

On a sheet of paper write out your explanation


12, 8, 14, 5, 1, 3, 0, 8, 10, 11

1

7.2

2

8

3

9

4

7.4

12

Remember

The mean is the average of the numbers. It is easy to calculate: add up all the numbers, then divide by how many numbers there are. In other words it is the sum divided by the count.

13

Multiple Choice

Christian has six grades from tests and IXL. They are all weighted equally. If Christian's grades are 100, 96, 96, 88, 70, and 100, what is the current average grade? (Round to the nearest whole number)

On a sheet of paper write out your explanation

1

90

2

91

3

92

4

93

14

Multiple Choice

Question image
1

Function

2

Not a Function

15

What is a function

One input to one output. It passes the vertical line test. connect all of the dots. Take a straight line and see if it passes through more than one point on the graph. For each X there is only one Y value.

Slide image

16

Multiple Choice

Question image

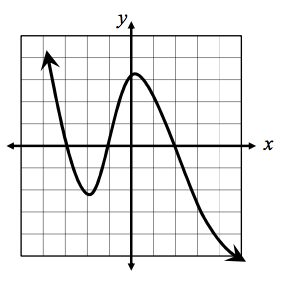
Is this graph a function or not a function?

On a sheet of paper write out your explanation

1

Function

2

Not a Function

17

Multiple Choice

Question image

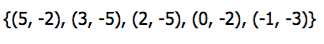
Is this set of ordered pairs a function or not a function?

On a sheet of paper write out your explanation

1

Function

2

Not a Function

18

Multiple Choice

Question image

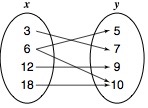
Is this mapping a function or not a function?

On a sheet of paper write out your explanation

1

Function

2

Not a Function

19

Multiple Choice

What is the range of the following relation:

(9, -2) (4, 3) ( 8, 10) ( -4, 8)

On a sheet of paper write out your explanation

1

-4, 4, 8, 9

2

-2, 3, 8, 10

3

(9, -2) ( 4, 3)

4

(8, 10) (-4, 8)

20

Multiple Choice

All of the x values or inputs are called what?
1
Domain
2
Range

21

Multiple Choice

For the function {(0,1), (1,-3), (2,-4), (-4,1)}, write the domain.

On a sheet of paper write out your explanation

1

D: {1, -3, -4,}

R: {0, 1, 2, -4}

2

D:{0, 1, 2, -4}

R:{1, -3, -4}

3

D:{0, 1, 2, 3, 4}

R:{1, -3, -4}

22

Multiple Choice

Question image
Kiki wants to rent a bounce house for her daughter's party.  The cost, y, to rent the bounce house for the number of hours, x, is shown in the table.  The initial set up fee for the bounce house is which of the following?
1
$65
2
$55
3
$130
4
$185

23

Multiple Choice

Evaluate f(-2) if f(x) = x2+ 3

1

-1

2

1

3

7

4

-7

24

Multiple Choice

The football team has decided to sell donuts in the mornings at school. The function f(n) is equal to the amount of money, in dollars, they earns after selling n number of donuts. At the end of of the morning they sold f(75) = 150. Enter the total number of donuts the team sold on that morning

1

150

2

75

3

11,250

4

225

25

Multiple Choice

Question image
What is the MEDIAN of this data
1
95
2
90
3
100
4
40

26

Multiple Choice

Question image
What is the MEAN for this data?
1
80
2
1040
3
13
4
81

27

Multiple Choice

Question image

The double dot plots show the average wait times in minutes for two popular rides at an amusement park. Compare the measures of center and variation, which ride typically has a longer wait time?

1

No inference can be made from the graph.

2

Topsy Turvy

3

The wait times are the same for both rides.

4

Rocket Blast

28

Multiple Choice

Question image

Compare the centers and spreads.

1

Math has a higher median (center) and a wider spread.

2

Math has a higher median (center) and a smaller spread.

3

Math has a lower median (center) and a smaller spread.

4

Math has a lower median (center) and a wider spread.

29

Multiple Choice

Question image

What is the median of the data?

1

105

2

106

3

104

4

110

30

Multiple Choice

Question image

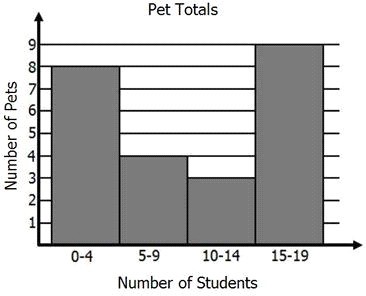
Which interval shows the greatest number of pets?

1

15-19

2

0-4

3

5-9

4

10-14

31

Multiple Choice

Question image

How many students will have exactly 6 coins in their pocket ?

1

5

2

2

3

Can't determine

4

3

32

Multiple Choice

Question image
Is the pictured graph growth, decay, or linear or none?  
1
Exponential Growth
2
Exponential Decay
3
Linear
4
None

33

Multiple Choice

Question image
Is the pictured graph growth, decay, or linear or none?  
1
Exponential Growth
2
Exponential Decay
3
Linear
4
None

34

Multiple Choice

Question image
Is the equation linear, exponential or neither?
1
Linear
2
Exponential
3
Neither

35

Multiple Choice

Question image
Is the equation linear, exponential or neither?
1
Linear
2
Exponential
3
Neither

Bench Mark Review 2

Slide image

Show answer

Auto Play

Slide 1 / 35

SLIDE