Search Header Logo
  1. Resource Library
  2. Math
  3. Data And Graphing
  4. ...
  5. Analyze Line Plots
Analyze Line Plots

Analyze Line Plots

Assessment

Presentation

Mathematics

2nd - 4th Grade

Practice Problem

Medium

CCSS
4.MD.B.4, 3.MD.B.4, 2.MD.D.9

+3

Standards-aligned

Created by

Ronda Pritchard

Used 491+ times

FREE Resource

3 Slides • 10 Questions

1

Analyze Line Plots

I can understand and use the information presented in a line plot.

Slide image

2

A Line Plot:

  • uses x's above a number line to show how often a data value occurs

  • the data presented in a line plot must be values or numbers

  • line plots must have a title (label)

3

Let's make a line plot together.

Here is our data: one person scored an 86, one person scored a 90, four people scored a 92, one person scored a 94, three people scored a 96, and two people scored 100.

4

Multiple Choice

Question image

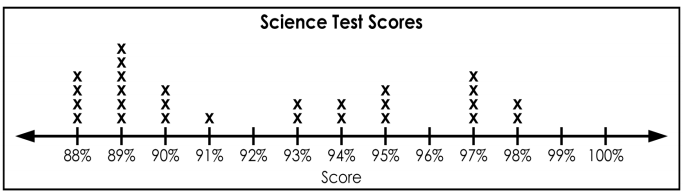
What is the highest score in the class?

1

88%

2

100%

3

13

4

98%

5

Multiple Choice

Question image

How many students received a score of 94%?

1

94

2

4

3

1

4

2

6

Multiple Choice

Question image

How many students received a score in the 90s?

1

6

2

2

3

91%

4

17

7

Multiple Choice

Question image

How many students scored 93% or less?

1

6

2

16

3

14

4

13

8

Multiple Choice

Question image

How many students received a score in the 80's?

1

2

2

10

3

14

4

27

9

Multiple Choice

Question image

How many people had 3 pets?

1

5

2

7

3

4

4

3

10

Multiple Choice

Question image

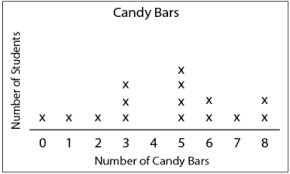
How many students had more than 6 candy bars?

1

5

2

2

3

3

4

1

11

Multiple Choice

Question image

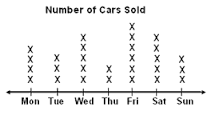
How many cars were sold on Saturday and Sunday?

1

5

2

3

3

8

4

10

12

Multiple Choice

Question image
How many of the rings are ¼ carat or less?
1
2
2
4
3
6
4
8

13

Multiple Choice

Question image

How many students have 0 Brothers and Sisters?

1

6 students

2

0 students

3

12 students

4

10 students

Analyze Line Plots

I can understand and use the information presented in a line plot.

Slide image

Show answer

Auto Play

Slide 1 / 13

SLIDE