
Module 1:Linear Inequalities in Two Variables
Presentation
•
Mathematics
•
8th Grade
•
Practice Problem
•
Medium
+6
Standards-aligned

Sarah Millan Guimary - Pelaris
Used 66+ times
FREE Resource
16 Slides • 25 Questions
1
Linear Inequalities in Two Variables
Objectives:
1. Differentiates linear inequalities in two variables from linear equations in two variables.
2. Illustrates and graphs linear inequalities in two variables.
3. Solves problems involving linear inequalities in two variables.

2
3
4

5
6

7
8

9
Multiple Choice
10
Multiple Choice
11
Multiple Choice
12
Multiple Choice
13
Multiple Choice
14
Multiple Choice
15
Multiple Choice
16
Multiple Choice
17
Multiple Choice
18
Multiple Choice
19
20

21
22
Multiple Choice
23
Multiple Choice
24
Multiple Choice
25
Multiple Choice
26
Multiple Choice
27
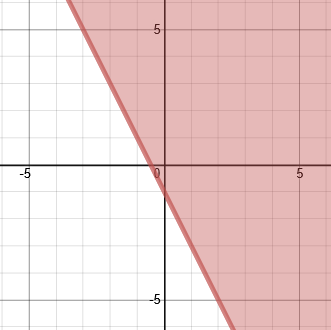
Lesson 1.3: Graphs of Linear Inequalities in Two Variables
The graph of a linear inequality in two variables is the set of all points in the rectangular
coordinate system in which ordered pairs satisfy the inequality.
When a line is graphed in the
coordinate plane, it separates the plane in two regions called half-planes (upper and lower).

28
29
30
31

The points found on the shaded area are the answers to the inequalities.
32
Multiple Choice
33
Multiple Choice
34
Multiple Choice
35
Multiple Choice
36
Multiple Choice
37
Multiple Choice
38
Multiple Choice
39
Multiple Choice
40
Multiple Choice

Is the point (3, 1) a solution for the following inequality? Choose the best answer that has the best explanation.
41
Multiple Choice
Linear Inequalities in Two Variables
Objectives:
1. Differentiates linear inequalities in two variables from linear equations in two variables.
2. Illustrates and graphs linear inequalities in two variables.
3. Solves problems involving linear inequalities in two variables.
Show answer
Auto Play
Slide 1 / 41
SLIDE
