
Double Bar Graphs
Presentation
•
Mathematics
•
4th Grade
•
Practice Problem
•
Easy
Standards-aligned

PAMELA FREITAG
Used 79+ times
FREE Resource
6 Slides • 1 Question
1
Double Bar Graphs
What are they and how are they useful?

2
What is a double bar graph?
A double bar graph is like a single bar graph except for it has multiple bars for each category. These different bars for each category are usually different colours or patterns. A legend or key is used to show what each colour or pattern mean.
What information can you tell from this double bar graph?

3
Favourite Sports
Amanda gave the students of her class a survey to determine their favourite sport. She decided to split the results into boy’s and girl’s. She created a bar graph to display the results of her survey.

4
Poll
5
6
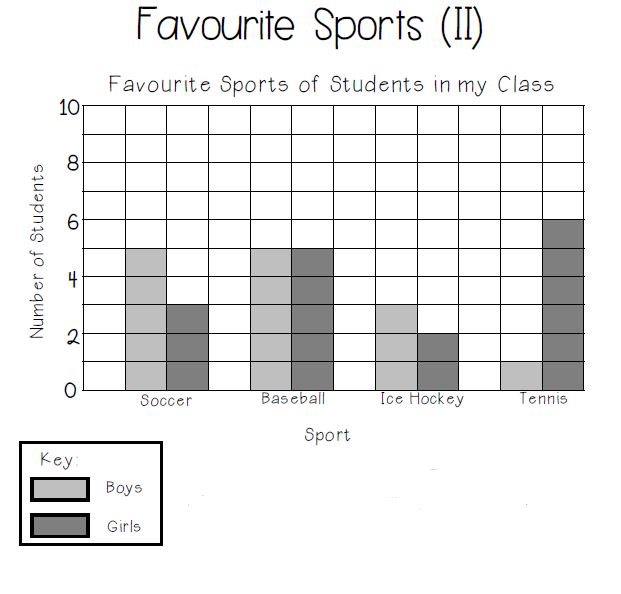
Amanda can create a Double Bar Graph!
A double bar graph of her data clearly shows the favourite sport of the boys and girls in her class.

7
Let's Analyse the Data
How many students were surveyed all together?
Which sport was the favourite of most girls?
Which sport was the favourite of most boys?
How many more girls liked tennis than boys?
Double Bar Graphs
What are they and how are they useful?
Show answer
Auto Play
Slide 1 / 7
SLIDE
