Search Header Logo
The Carrying Capacity of Ecosystems Lesson

The Carrying Capacity of Ecosystems Lesson

Assessment

Presentation

Science, Biology

9th - 12th Grade

Medium

NGSS
MS-LS2-4, MS-ESS3-4, HS-LS2-1

+6

Standards-aligned

Created by

David Blankenship

Used 39+ times

FREE Resource

27 Slides • 36 Questions

1

The Carrying Capacity of Ecosystems Lesson

Slide image

2

Slide image

3

Slide image

4

Slide image

5

Slide image

6

Slide image

7

Fill in the Blanks

Type answer...

8

Slide image

9

Slide image

10

Slide image

11

Slide image

12

Slide image

13

Slide image

14

Slide image

15

Slide image

16

Multiple Choice

Question image

The graph to the right shows the interaction of the wolf and moose populations on Isle Pekie. If the moose population continues to increase, the wolves' food supply will increase. What will most likely happen to the wolf population as a result?

1

It will decrease.

2

It will increase.

3

It will remain the same.

17

Multiple Choice

Question image

If the carrying capacity of a predator decreases, what will happen to the carrying capacity of the prey?

1

Will Increase

2

Will Decrease

3

Will stay the same

18

Multiple Choice

The largest number of individuals that an area can support is called its _______.
1
limiting factor
2
abiotic factor
3
resource availability
4
carrying capacity

19

Multiple Choice

This may cause a population to increase

1

increase of food supply

2

removal of predators

3

removal of disease

4

all of these

20

Multiple Choice

Question image

What is the carrying capacity of the graph?

1

1000

2

8000

3

800

4

600

21

Multiple Choice

Question image

b

1

exponential growth

2

growth slows

3

growth stops

4

growth begins

22

Multiple Choice

Question image
1

exponential growth curve

2

logistic growth curve

23

Multiple Choice

Which of the following is NOT an example of a limiting factor?

1

primary productivity

2

limiting nutrient

3

exponential growth

4

disease

24

Multiple Choice

The range or area occupied by a population is its

1

growth rate

2

geographic distribution

3

age structure

4

population density

25

Multiple Choice

All of the following are density-independent factors except:

1

seasonal changes

2

hurricanes

3

less space

4

deforestation

26

Multiple Choice

Population density can be best described as:

1

The amount of deaths that occur in a population

2

The amount of births that occur in a population

3

The amount of individuals in a given space.

4

The amount of available nutrients in an ecosystem

27

Multiple Choice

In a given area, if the population of predators increases, the population of prey will _____________.

1

increase

2

decrease

3

remain about the same

4

go extinct

28

Multiple Choice

Which of the following would cause a population to increase in size?

1

Emigration

2

Decreased Birthrate

3

Immigration

4

Increased Deathrate

29

Multiple Choice

Emigration is:

1

When a population continues to increase.

2

When individuals move into an area.

3

When individuals move out of an area.

4

The study of human popuations.

30

Multiple Choice

Typical population growth is described as:

1

Logarithmic growth

2

Logistic growth

3

Linear growth

4

Exponential growth

31

Multiple Choice

The movement of individuals into an area is known as:

1

Supplementation

2

Emigration

3

Immigration

4

Eradication

32

Multiple Choice

A density-dependent limiting factor only becomes limiting if:

1

A population begins to decrease in size.

2

Random events occur in nature.

3

There are predator-prey interactions.

4

A population reaches its carrying capacity.

33

Slide image

34

Multiple Choice

Question image

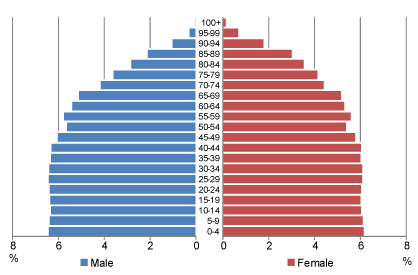
The image shows a _________ distribution

1

clumped

2

uniform

3

random

35

Multiple Choice

Question image
What is the carrying capacity of the following graph?
1
1000
2
8000
3
800
4
600

36

Multiple Choice

Question image
Which kind of dispersion is #1?
1
clumped
2
random
3
uniform

37

Multiple Choice

Question image
What kind of growth is this country experiencing?
1
Exponential Growth
2
Stable Growth
3
Declining Growth

38

Multiple Choice

Question image
According to the age structure of this country, its population is most likely...
1
growing slowly.
2
growing rapidly.
3
decreasing.
4
not changing.

39

Multiple Choice

Environmental factors that are not affected by the population size or density
1
density-dependent factors
2
exponential growth 
3
logistic growth
4
density-independent factors

40

Multiple Choice

A graph either type I, II, or III that depicts either the proportion or number of people surviving at each age for a specific group or species.
1
density-dependent factors
2
carrying capacity
3
population density
4
survivorship curve

41

Multiple Choice

Question image

At what hour did the bacterial population carrying capacity?

1

1-7 hours

2

8-14 hours

3

14-17 hours

4

18 hours - 24 hours

42

Multiple Select

Click density independent factor(s).

1

competition for resources

2

predator-prey relationships

3

parasitism and disease

4

weather, natural disaster and man made disturbances

43

Multiple Select

Click density dependent factor(s).

1

competition for resources

2

predator-prey relationships

3

parasitism and disease

4

weather

44

Multiple Choice

Question image

Describes organisms with a high death rate (or low survivorship rate) immediately following birth. Examples include bacteria, fishes, and invertebrates.

1

Type I

2

Type II

3

Type III

4

Type IV

45

Multiple Choice

Question image

Tracks organisms that tend to live long lives (low death rate and high survivorship rate); toward the end of their life expectancies, however, there is a dramatic increase in the death rate.

1

Type I

2

Type II

3

Type III

4

Type IV

46

Multiple Choice

What is the angle of the Earth's tilt?
1
24°
2
23.5°
3
23°
4
22.5°

47

Multiple Select

Question image

Identify the items on the graph that have a positive impact on Climate Change (make CC less bad).

1

livestock

2

crops

3

forests

4

urban trees

5

wetlands

48

Slide image

49

Slide image

50

Slide image

51

Slide image

52

Multiple Choice

all of the following are examples of human induced change except one

1

volcanic eruptions

2

pollution

3

use of pesticides

4

land clearing

53

Multiple Choice

What are some effects of climate change?

1

flooding and rising sea levels

2

melting of ice caps and lower sea levels

3

decrease in carbon dioxide levels

4

increase of tree growth

54

Multiple Choice

Question image

How is climate change affecting biodiversity?

1

increase in biodiversity

2

decrease in biodiversity

3

no change in biodiversity

4

has no effect on biodiversity

55

Multiple Choice

Question image

A process of land degradation that leads to land becoming drier/arid or more ‘desert-like’?

1

desertification

2

deforestation

3

drought

4

farming

56

Slide image

57

Slide image

58

Slide image

59

Slide image

60

Slide image

61

Slide image

62

Slide image

63

Slide image

The Carrying Capacity of Ecosystems Lesson

Slide image

Show answer

Auto Play

Slide 1 / 63

SLIDE