Search Header Logo
  1. Resource Library
  2. Math
  3. Data And Graphing
  4. ...
  5. Scatter Plots
Scatter Plots

Scatter Plots

Assessment

Presentation

Mathematics

8th Grade

Practice Problem

Medium

CCSS
HSS.ID.B.5, HSF-LE.A.1B, HSF.IF.B.4

+5

Standards-aligned

Created by

William Miley

Used 492+ times

FREE Resource

2 Slides • 13 Questions

1

Scatter Plots

media

2

Reminders

***Association and Correlation are the same thing!!!

media

3

Multiple Choice

Question image

Based on the scatterplot, which of the following conclusions about the relationship between her height and weight is true?

1

There is a negative relationship between height and weight

2

There is a positive relationship between height and weight

3

There is a constant relationship between height and weight

4

There is no relationship between height and weight

4

Multiple Choice

Question image

What type of correlation does this scatter plot show?

1

positive

2

negative

3

no correlation

4

nonlinear association

5

Multiple Choice

Question image

Describe the correlation in the graph shown.

1

Strong Negative

2

Strong Positive

3

Weak Negative

4

Weak Positive

6

Multiple Choice

Question image

Which sentence describes the relationship shown on this scatter plot?

1

As the temperature decreases, the visitors increase.

2

As the temperature increases, the number of visitors increases.

3

As the visitors increase, the temperature decreases.

4

No correlation

7

Multiple Choice

The number of siblings you have and your weight. 
1

Positive correlation

2

Negative correlation

3

No correlation

8

Multiple Choice

What type of correlation (association)?
The outside temperature and the amount of layers you wear. 
1

Positive correlation

2

Negative correlation

3

No correlation

9

Multiple Choice

You are analyzing a scatter plot that has a negative correlation. What is true of the of the x and y values?
1

As x increases, y decreases

2

As x increases, y increases

3

As x decreases, y decreases

10

Multiple Choice

Question image
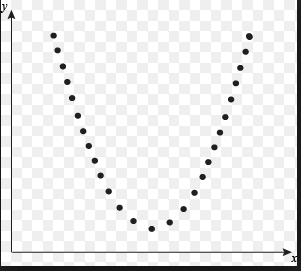
What type of association does this scatter plot represent?
1

positive linear association

2

negative association

3

no association

4

nonlinear association

11

Multiple Choice

Question image
What type of association does this graph have?
1

positive

2

negative

3

none

4

all of the above

12

Multiple Choice

Question image
What is the type of association?
1

Negative 

2

no association

3

positive 

13

Multiple Choice

Question image
Which scatter plot shows a linear relationship between x and y?
1

Graph A

2

Graph B

3

Graph C

4

Graph D

14

Multiple Choice

Question image
What type of association does this graph have?
1

positive 

2

negative

3

none

4

all of the above

15

Poll

How well do you understand scatter plots?

Thumbs up! (I got it)

Thumbs Sideways(Im getting it)

Thumbs down(why do we keep learning japanese in math?)

Scatter Plots

media

Show answer

Auto Play

Slide 1 / 15

SLIDE