Search Header Logo
  1. Resource Library
  2. Math
  3. Data And Graphing
  4. Describing Quantitative Data
Describing Quantitative Data

Describing Quantitative Data

Assessment

Presentation

•

Mathematics

•

11th Grade - University

•

Medium

•
CCSS
2.MD.D.9, 8.SP.A.4, 6.SP.B.4

+2

Standards-aligned

Created by

Tiffany Sims

Used 77+ times

FREE Resource

3 Slides • 17 Questions

1

1.3 Describing Quantitative Data

Frequency, Relative Frequency, Dotplots, Stemplots, Histograms

media

2

Graphical Representations of Data

  • dot plot consists of a number line and dots (or points) positioned above the number line.

  • Stem plots split each data value into a "leaf" (usually the last digit) and a "stem" (the other digits).

  • Histograms use vertical columns to show frequencies.

media

3

Fill in the Blank

Question image

What is the difference (in feet) between the shortest and the longest distance of the baseball thrown?

4

Fill in the Blank

Question image

How many baseballs were thrown 5 or more feet?

5

Multiple Choice

Question image
How many students scored more than 80%?
1
10
2
13
3
7
4
15

6

Fill in the Blank

Question image

What is the difference between the highest score and the lowest score on the test?

7

Multiple Choice

Question image

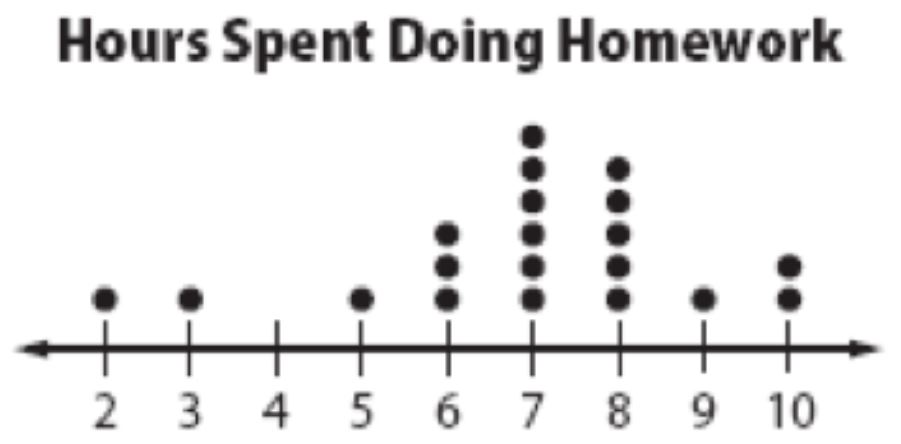
How many students spent 7 hours doing homework that week?

1

1

2

3

3

5

4

6

8

Multiple Choice

Question image
How many students are between 60 and 63 inches tall?
1
3
2
0
3
12
4
7

9

Multiple Select

Question image

Which choices best describe the shape of the data? (Check all that apply.)

1

unimodal

2

bimodal

3

Left Skewed

4

Right Skewed

5

Symmetric

10

Fill in the Blank

Question image

How many students scored between a 86 and a 90?

11

Multiple Choice

Question image
Which interval shows the greatest number of pets?
1
15-19
2
0-4
3
5-9
4
10-14

12

Frequency and Relative Frequency

  • frequency is the number of times a value of the data occurs.

  • relative frequency is the ratio of the frequency to the total number of outcomes.

  • Cumulative relative frequency is the sum of the current previous relative frequencies.

media

13

Multiple Choice

Question image

A clumsy teacher spilled coffee over this table of his students' test results. How many students scored below 18?

1

4

2

23

3

18

4

19

14

Multiple Choice

Question image

A clumsy teacher spilled coffee over this table of his students' test results. How many students scored exactly 17?

1

4

2

8

3

2

4

cannot be determined

15

Multiple Choice

Question image

What is the missing number?

1

4

2

5

3

20

4

36

16

Fill in the Blank

Question image

What is the missing number in the cumulative frequency column?

17

Multiple Choice

Question image

How many scores were 26 or below?

1

10

2

20

3

5

4

25

18

Multiple Choice

Question image
What is the relative frequency of students speaking Spanish?
1
16%
2
12%
3
24%
4
48%

19

Multiple Choice

Question image
What is the relative frequency of students speaking Arabic?
1
32%
2
24%
3
10%
4
2%

20

Multiple Choice

Question image

The table above shows a cumulative frequency distribution of runners' ages. According to the table, how many runners are in their forties?

1

25

2

7

3

6

4

10

1.3 Describing Quantitative Data

Frequency, Relative Frequency, Dotplots, Stemplots, Histograms

media

Show answer

Auto Play

Slide 1 / 20

SLIDE