Search Header Logo
Types of Data and Bar Charts

Types of Data and Bar Charts

Assessment

Presentation

Mathematics

4th - 7th Grade

Practice Problem

Medium

Created by

Abigael Kirby

Used 5+ times

FREE Resource

9 Slides • 28 Questions

1

Types of Data and Bar Charts
Slide image

2

Slide image

3

Multiple Choice

Reading a book about a research on sunflowers and using the data on growth rates,

1

Primary Data

2

Secondary Data

4

Multiple Choice

I conduct a survey and questionnaire to find out the favourite ice cream flavour of Year 9 pupils.

1

Primary Data

2

Secondary Data

5

Multiple Choice

I compare data from websites on the life span of dogs.

1

Primary Data

2

Secondary Data

6

Multiple Choice

I stop random people on the street and ask them if they like living in Leyland.

1

Primary Data

2

Secondary Data

7

Multiple Choice

I use a government census to look at the average age of people living in Leyland.

1

Primary Data

2

Secondary Data

8

Slide image

9

Multiple Choice

I ask people to write a sentence on what their best memory from Balshaws is.

1

Qualitative Data

2

Quantitative Data

10

Multiple Choice

I record how many minutes late pupils are on a Monday morning.

1

Qualitative Data

2

Quantitative Data

11

Multiple Choice

I record how many people put their tray away after lunch on a tally chart.

1

Qualitative Data

2

Quantitative Data

12

Multiple Choice

I give students a questionaire asking them to tell me why they dislike vegetables.

1

Qualitative Data

2

Quantitative Data

13

Slide image

14

Multiple Choice

Data collected on the average temperature on the surface of mars.

1

discrete (count it)

2

continous (measure it)

15

Multiple Choice

Data collected on how many people have a certain hair colour in a class. I.e. how many have blonde, brown, red hair.

1

discrete (count it)

2

continous (measure it)

16

Multiple Choice

Data collected on how many children wear black coats to school.

1

discrete (count it)

2

continous (measure it)

17

Multiple Choice

Data collected on how far pupils jump in the long jump.

1

discrete (count it)

2

continous (measure it)

18

Multiple Choice

Data collected on how much babies weigh when they are born.

1

discrete (count it)

2

continous (measure it)

19

Slide image

20

Multiple Select

Select all that are an advantage of sample data.

1

It is less expensive

2

It is more expensive

3

It is quicker to conduct

4

It takes into account all views and possible data.

21

Multiple Select

Select all that are an advantage of population data.

1

It is less expensive

2

It is more expensive

3

It is quicker to conduct

4

It takes into account all views and possible data.

22

Slide image

23

Slide image

24

Multiple Choice

Select the correct rule when drawing a bar chart.

1

All bars should be the same height.

2

All bars should be the same width.

3

All bars should be the same colour.

25

Multiple Choice

Select the correct rule when drawing a bar chart.

1

Both axis should have a title/label.

2

The axis do not need to be labelled.

3

You only need a title at the top.

26

Multiple Choice

Select the correct rule when drawing a bar chart.

1

The horizontal axis is always labelled frequency.

2

The vertical axis is always labelled frequency.

3

Both axis are labelled frequency.

27

Slide image

28

Interpreting Bar Charts

How can we get information from and tell what a bar chart is telling us about something?

29

Multiple Choice

Question image

How many employees travelled by bus to work?

1

22

2

8

3

10

4

12

30

Multiple Choice

Question image

How many employees walked to work?

1

22

2

8

3

10

4

12

31

Multiple Choice

Question image

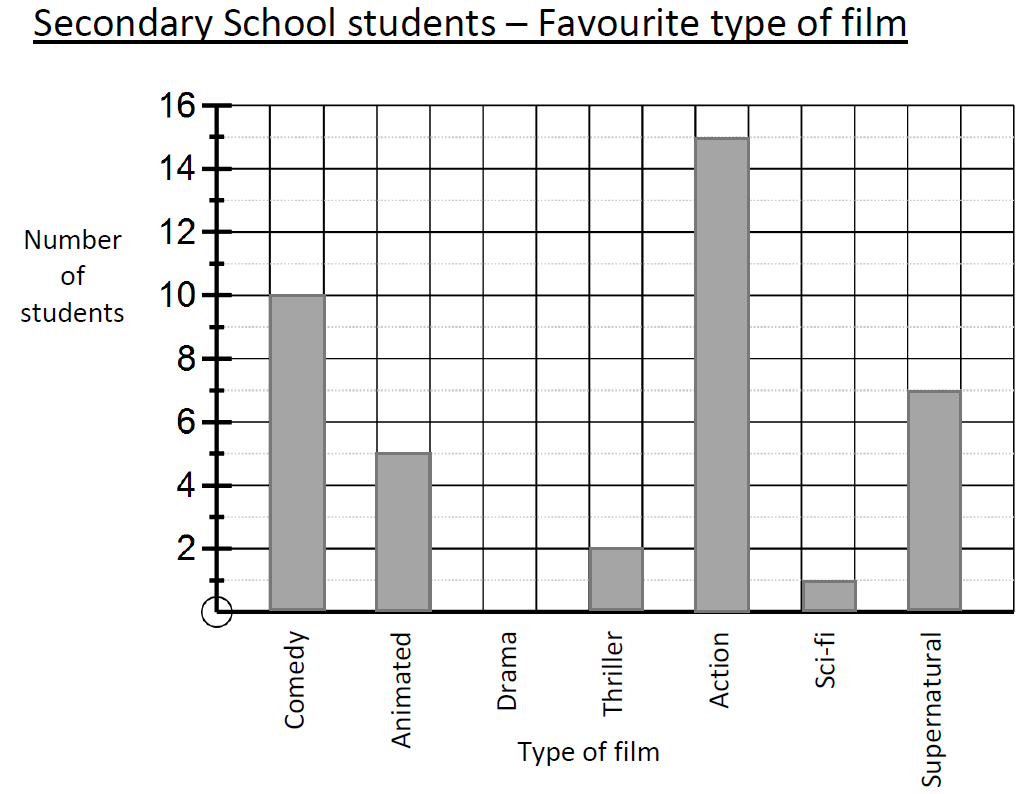
How many people said Thriller was their favourite type of film?

1

0

2

2

3

1

4

7

32

Multiple Choice

Question image

How many people said Drama was their favourite type of film?

1

0

2

2

3

1

4

7

33

Multiple Choice

Question image

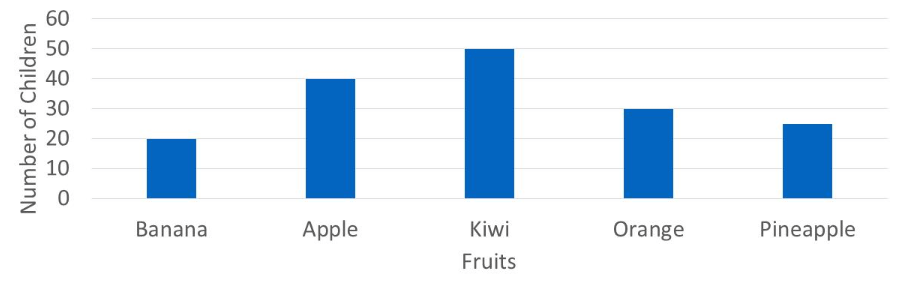
Which of the following statements is true?

1

pineapple is the most popular

2

only apple is liked more than orange

3

kiwi is the least popular fruit

4

apple is the second most popular fruit

34

Multiple Choice

Question image

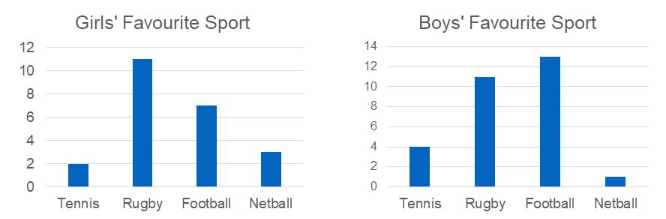
Which sport was picked by the same number of girls and boys?

1

tennis

2

football

3

netball

4

rugby

35

Multiple Choice

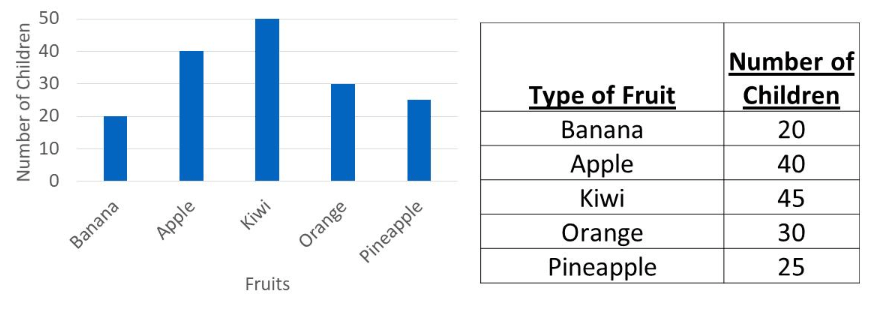
Question image

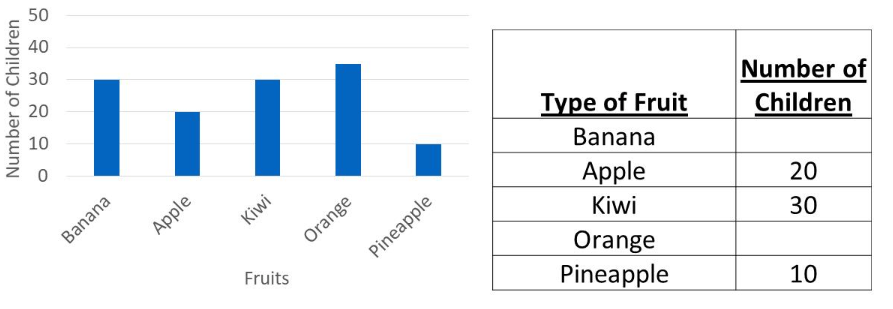
using the bar chart, what 2 numbers are missing from the table?

1

30 and 35

2

30 and 40

3

pineapple, banana

4

35 and 40

36

Multiple Choice

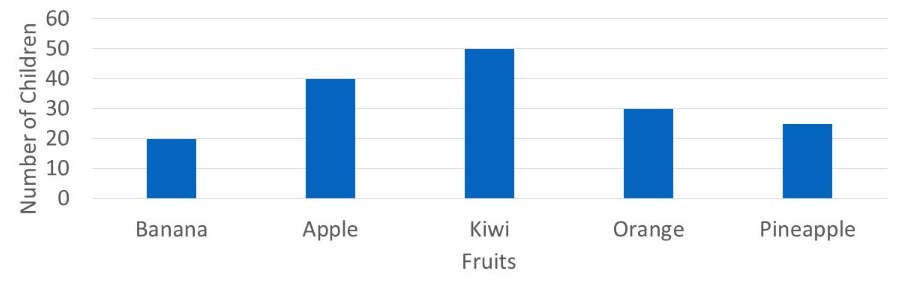
Question image

Which fruit's bar is displayed correctly?

1

banana

2

orange

3

apple

4

kiwi

37

Multiple Choice

Question image

Which of the following statements is true?

1

banana is the most popular fruit

2

only pineapple is liked less than oranges

3

kiwi is the most popular fruit

4

apple is the third most popular fruit

Types of Data and Bar Charts

Slide image

Show answer

Auto Play

Slide 1 / 37

SLIDE