
Bar Graphs
Presentation
•
Mathematics
•
7th Grade
•
Medium
+2
Standards-aligned

Daffney Brown
Used 14+ times
FREE Resource
2 Slides • 10 Questions
1
Bar Graphs
Unit 8 Note Packet; 1st Page

2
3
Multiple Choice
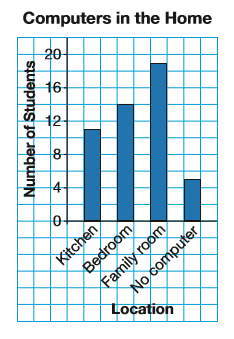
How many students were asked?
4
Multiple Choice
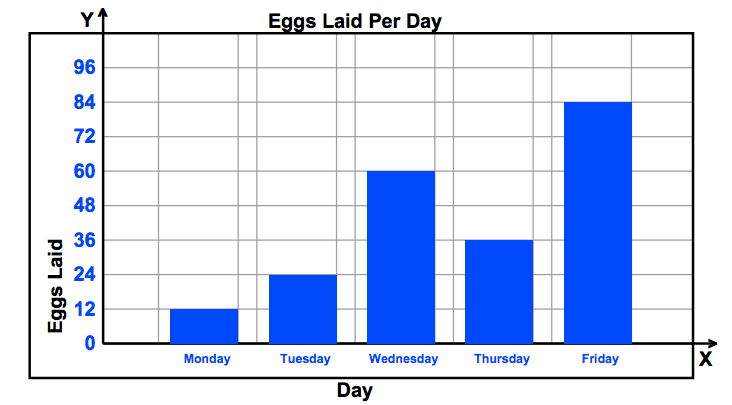
How many more eggs were laid on Friday than Wednesday?
5
Multiple Choice
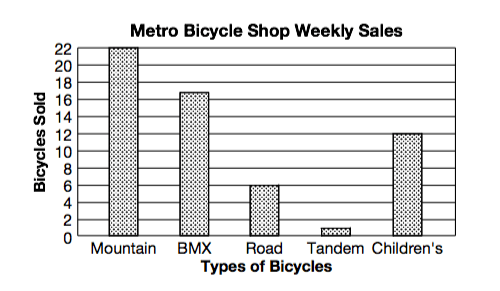
How many BMX bikes were sold?
6
Multiple Choice
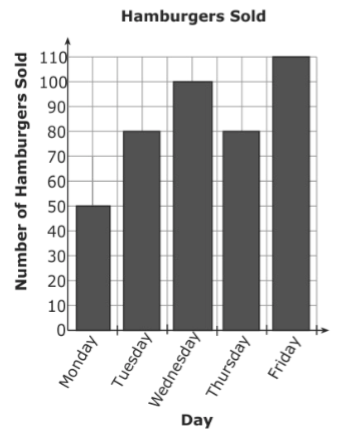
The bar graph shows the number of hamburgers sold at Bob’s Burger Shack. On which days were more than 80 hamburgers sold?
7
Multiple Choice
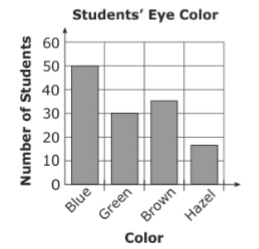
Miss Lee's science class collected data on the color of 3rd grade student's eyes. The students created a bar graph with this information. How many more students had blue eyes than green eyes?
8
Multiple Choice
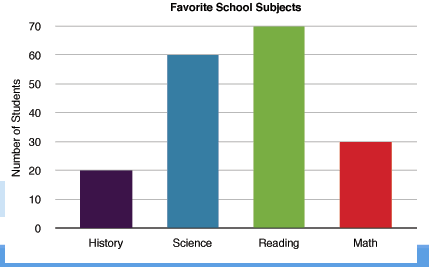
9
Multiple Choice
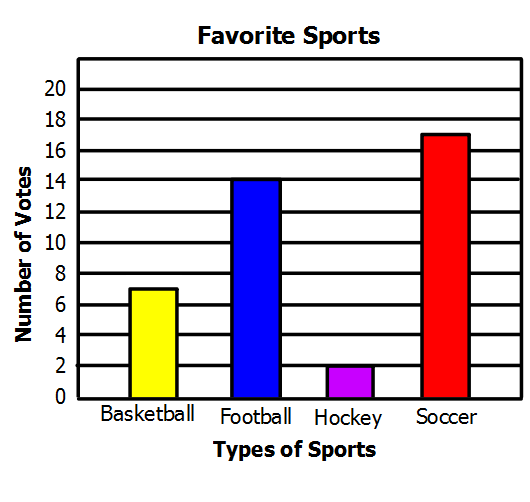
10
Multiple Choice

How many more people like purple than red?
11
Multiple Choice
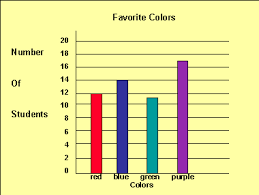
How many students' favorite color is blue?
12
Multiple Choice

Look at the Bar Graph "Student Grades". Which grade did the smallest number of students get?
Bar Graphs
Unit 8 Note Packet; 1st Page
Show answer
Auto Play
Slide 1 / 12
SLIDE
