Search Header Logo
Review Rate of Change U5 Mid Lesson 10

Review Rate of Change U5 Mid Lesson 10

Assessment

Presentation

Mathematics

9th Grade

Hard

CCSS
8.F.B.4, 8.F.A.2, HSF.IF.B.4

+2

Standards-aligned

Created by

Jessica Nolen

Used 7+ times

FREE Resource

3 Slides • 7 Questions

1

Review Rate of Change U5 Mid Lesson 10

Slide image

2

Slide image

3

From a Table & Graph

  • Select ANY two points (ordered pairs) from the graph

  • Select ANY two points (ordered pairs) from the table

4

Multiple Choice

Question image
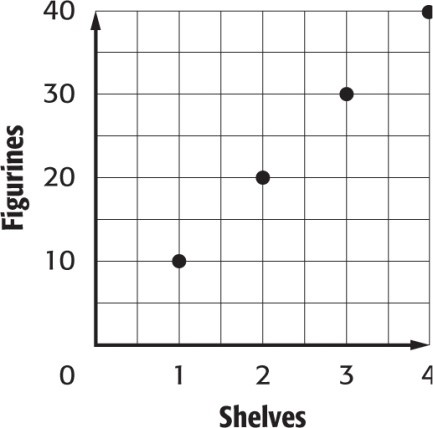
Which rate of change represents the following graph?
1
5 figurines on 1 shelf
2
0.5 figurines on 1 shelf
3
10 figurines on 1 shelf
4
40 figurines on 1 shelf

5

Multiple Choice

Question image
Which company shows a greater rate of change?
1
Water's Edge Rafts
2
Ryan's Rafts

6

Multiple Choice

Question image

At what rate did the rain fall?

1

2 cm per hour

2

1/4 cm per hour

3

1/2 cm per hour

4

4 cm per hour

7

Multiple Choice

Question image

Use the graph to calculate the rate of change.

1

1

2

-1

3

2

4

-2

8

Multiple Choice

Question image
What is the rate of change for the following graph?
1
80
2
20
3
40
4
160

9

Multiple Choice

Question image
Find the rate of change
1
3
2
-3
3
20
4
Not a constant slope/Non-Linear

10

Multiple Choice

Question image
Find the rate of change
1
1
2
2
3
11
4
slopeNot a constant slope/Non-Linear

Review Rate of Change U5 Mid Lesson 10

Slide image

Show answer

Auto Play

Slide 1 / 10

SLIDE