
Graphing Inequalities
Presentation
•
Mathematics
•
6th Grade
•
Medium
•
CCSS
6.EE.B.8, 6.EE.B.5
Standards-aligned

Charles Peters
Used 87+ times
FREE Resource
1 Slide • 11 Questions
1
Graphing Inequalities

2
Multiple Choice
3
Multiple Choice
4
Multiple Choice
5
Multiple Choice
6
Multiple Choice

What inequality does the number line graph represent?
7
Multiple Choice

Which graph matches the inequality
r ≥ -6?
r ≥ -6?
8
Multiple Choice

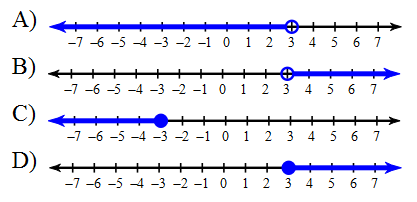
Which graph matches the inequality
k < 3?
k < 3?
9
Multiple Choice
10
Multiple Choice
11
Multiple Choice

Which graph matches the inequality
2 > p?
2 > p?
12
Multiple Choice
Which graph matches the inequality
k < 3?
Graphing Inequalities
Show answer
Auto Play
Slide 1 / 12
SLIDE
