Search Header Logo
  1. Resource Library
  2. Math
  3. Data And Graphing
  4. ...
  5. Scatter Plots
Scatter Plots

Scatter Plots

Assessment

Presentation

Mathematics

7th - 9th Grade

Medium

CCSS
HSF-LE.A.1B, HSF.IF.B.4, HSS.ID.B.5

Standards-aligned

Created by

7th grade

Used 26+ times

FREE Resource

5 Slides • 5 Questions

1

Scatter Plots

How do we interpret scatter plots?

Slide image

2

Scatter Plot

  • A graph in which the values of two variables are plotted along two axes

  • The pattern of the resulting points reveals any correlation present

3

Example

The local ice cream shop keeps track of how much ice cream they sell versus the noon temperature on that day. Here are their figures for the last 12 days:


Slide image

4

And here is the same data as a Scatter Plot:


Notice anything?

Slide image

5

Slide image

6

Multiple Choice

Question image

What is the correlation between length of running start and distance of jump?

1

positive: the further you run the further you jump

2

negative: the less you run the less distance of your jump

3

positive: the further your running start the less your distance

7

Multiple Choice

Question image

What type of association does this scatter plot show?

1

positive linear association

2

negative linear association

3

no association

4

nonlinear association

8

Multiple Choice

If a scatterplot has no association then...

1

...it has no ordered pairs

2

...it has ordered pairs that have a negative pattern

3

...its ordered pairs have no predictable pattern

4

...if it makes a lion on a graph (roar!)

9

Multiple Choice

Question image
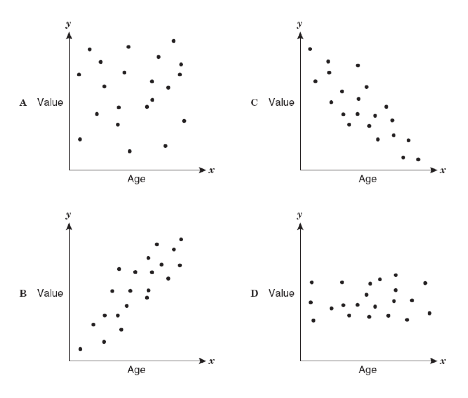
As the age of the car increases, its value decreases. Which scatterplot represents this relationship?
1
A
2
B
3
C
4
D

10

Multiple Choice

Question image
What is the correlation?
1
Negative correlation
2
No correlation
3
Positive correlation
4
All of the above

Scatter Plots

How do we interpret scatter plots?

Slide image

Show answer

Auto Play

Slide 1 / 10

SLIDE