
Describing Data
Presentation
•
Mathematics
•
9th Grade
•
Medium
+5
Standards-aligned
Leah Leonard
Used 119+ times
FREE Resource
9 Slides • 17 Questions
1
Describing Data
Using SOCS!
2
3
Multiple Choice
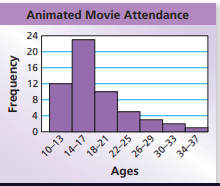
What is the shape of the data?
symmetrical
skewed left
skewed right
bell curve
4
Multiple Choice
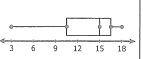
Which of the following best describes the shape of the distribution?
SKEWED LEFT
SKEWED RIGHT
UNIFORM
SYMMETRICAL
5
Multiple Choice
What is shape of the data?
symmetrical
skewed left
skewed right
6
7
Multiple Choice
Your math grades are 90, 85, 58, 90, 80, 100, and 90. Which grade is the outlier?
90
58
8
Multiple Choice
Describe the outliers in the distribution.
There is an outlier at 2.8
There is an outlier at 2.4
There are no outliers.
9
Multiple Choice
Given the 5 number summary, the minimum is an outlier.
True
False
10
11
Multiple Choice
Given the following distributions, which has the highest median?
Red
Purple
Black
12
Multiple Choice
What measure best describes the center of the data distribution?
*Hint - If the data is uniform or symmetric, the use either mean or median. If the data is skewed, then use the median.
spread
mean
peak
median
13
Multiple Choice
Over the last five days, Jen ran 4, 3, 2, 3, and 2.5 miles. The most appropriate measure of center for this data is:
Mean because all the numbers are close together.
Median because all the numbers are close together.
Mean because 2 is much lower than the other numbers.
Median because 2 is much lower than the other numbers.
14
Multiple Choice
The distribution of data is skewed right. What is the relationship between the mean and median?
median > mean
mean > median
mean = median
Impossible to tell.
15
16
Multiple Choice
Find the range of the data.
63, 71, 65, 66, 87, 53
32
33
34
35
17
Multiple Choice
Which has a larger IQR?
Zach
Steven
They have the same IQR
18
Multiple Choice
If a number is added to the set that is in the middle of the data, how does this affect the range?
increase
decrease
stay the same
both increase and decrease
19
Multiple Choice
Which dot plot shows a larger spread of data?
Basketball Players
Softball Players
20
21
22
23
24
Multiple Choice
Which of the following statements are true?
There is an outlier at 17.
The range is 18.
19 tickets were sold.
All of the above.
25
Multiple Choice
Which inference about the two populations is true
Both sets of data have the same interquartile range
Both sets of data have the same median
Ander's data centers areound 6 and Marcus's data centers around 7
The interquartile range for Ander's data is .5 greater than the interquartile range for Marcus's data
26
Open Ended
SUMMARY - Answer the following question(s) Use complete sentences.
Ms. Leonard looked at the grades of her class’ retake of their last quiz. How would you describe this data? (Describe using SOCS)
What conclusions can you draw about this class’ performance on the retake exam? Hint* Did they do well or not? How do you know?
Describing Data
Using SOCS!
Show answer
Auto Play
Slide 1 / 26
SLIDE
Similar Resources on Wayground
21 questions
Factoring GCF, Difference of Squares, and Trinomials Review
Presentation
•
9th Grade
21 questions
Domain and range
Presentation
•
9th Grade
21 questions
Quadratic Formula
Presentation
•
9th Grade
19 questions
Coordinate Plane
Presentation
•
9th Grade
18 questions
Slope Intercept Form Review
Presentation
•
9th Grade
19 questions
Geometry Midterm Review
Presentation
•
9th Grade
20 questions
Proofs In Geometry
Presentation
•
9th Grade
21 questions
Integer Operations Review
Presentation
•
9th Grade
Popular Resources on Wayground
10 questions
Factors 4th grade
Quiz
•
4th Grade
10 questions
Cinco de Mayo Trivia Questions
Interactive video
•
3rd - 5th Grade
13 questions
Cinco de mayo
Interactive video
•
6th - 8th Grade
20 questions
Math Review
Quiz
•
3rd Grade
20 questions
Main Idea and Details
Quiz
•
5th Grade
20 questions
Context Clues
Quiz
•
6th Grade
20 questions
Inferences
Quiz
•
4th Grade
19 questions
Classifying Quadrilaterals
Quiz
•
3rd Grade
Discover more resources for Mathematics
20 questions
Algebra 1 EOC Review 1
Quiz
•
9th Grade
5 questions
A.EO.1-4 Quizizz Day 1
Quiz
•
9th - 12th Grade
5 questions
A.EO.1-4 Quizizz Day 2
Quiz
•
9th - 12th Grade
5 questions
A.EI.1-3 Quizizz Day 4
Quiz
•
9th - 12th Grade
21 questions
Factoring Trinomials (a=1)
Quiz
•
9th Grade
15 questions
Algebra 1 EOC Review #1
Quiz
•
9th Grade
5 questions
A.EI.1-3 Quizizz Day 6
Quiz
•
9th - 12th Grade
5 questions
G.RLT.1-3 Quizizz Day 1
Quiz
•
9th - 12th Grade