
Line of best fit
Presentation
•
Mathematics
•
8th - 10th Grade
•
Medium
+8
Standards-aligned

Ray Boese
Used 20+ times
FREE Resource
7 Slides • 37 Questions
1
Line of best fit
You are learning on your own, pay attention to each question as it will help build your understanding.

2
3
Multiple Choice

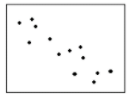
Which of the following lines represents the line of best fit for the scatter plot?
4
Multiple Choice

Which of the following lines represents the line of best fit for the scatter plot?
5
Multiple Choice

Which of the following lines represents the line of best fit for the scatter plot?
6
Multiple Choice

Which of the following lines represents the line of best fit for the scatter plot?
7
Multiple Choice

Select the statement that best describes the line.
8

9
Multiple Choice

What type of association (correlation) does this graph have?
10
Multiple Choice

11
Multiple Choice

12
Multiple Choice
13
Multiple Choice

14
Multiple Choice

15
Multiple Choice

The red line represents the line of best fit for the scatter plot. How many ice cream sales are expected if the temperature is 90°?
16
Multiple Choice

The scatter plot shows the relationship between the number of chapters and the total number of pages for several books. Use the trend line to predict how many pages would be in a book with 19 chapters.
17
18
Multiple Choice

Write the equation for the line.
19
Multiple Choice

20
Multiple Choice

Find the slope of the line.
21
Multiple Choice
22
Multiple Choice
23
Multiple Choice
24
Multiple Choice

Which line is the best line of best fit?
25
26
Multiple Choice

What is the solution?
27
Multiple Choice

The graphs of two linear equations are shown. What is the best estimate of the solution to the system of linear equations?
28
Multiple Choice

29
Multiple Choice
30
Multiple Choice

Which system of linear equations is shown on the graph?
31
Multiple Choice

Which system of linear equations represents the graph shown?
32
Multiple Choice
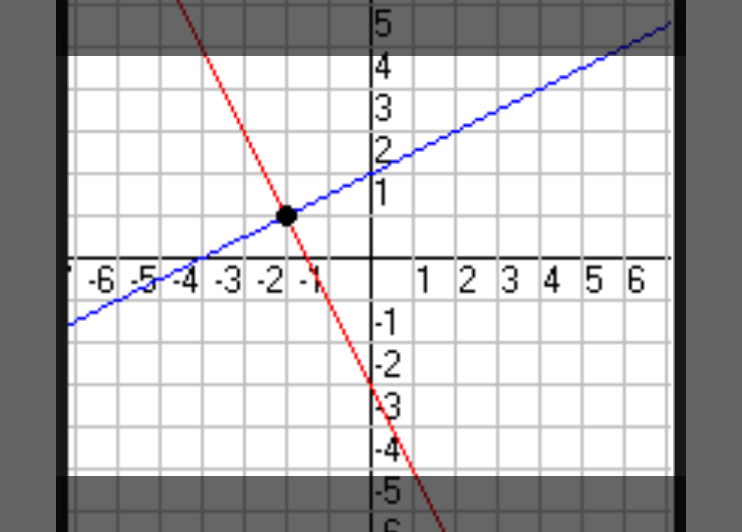
What is the solution to the system of equations graphed below?
33
Multiple Choice

How many solutions does this system have?
34
Multiple Choice
35
Multiple Choice

What is the solution?
36
Fill in the Blanks

Type answer...
37
38
Multiple Choice

What is the equation of the line of best fit?
39
Multiple Choice

What is the equation of the line of best fit
40
Multiple Choice

What is the equation of the line of best fit?
41
Multiple Choice

Which of the following could be a possible line of best fit for the data?
42
Multiple Choice

Is this line an accurate line estimate of best fit for the data?
43
Multiple Choice

What type of association does this graph show?
44
Line of best fit
You are learning on your own, pay attention to each question as it will help build your understanding.
Show answer
Auto Play
Slide 1 / 44
SLIDE
