- Resource Library
- Math
- Probability And Statistics
- Tree Diagrams
- M5.l7 Tree Diagram And Counting Principal

M5.L7 Tree Diagram and Counting Principal
Presentation
•
Mathematics
•
7th Grade
•
Easy
Standards-aligned

Christine Henderson
Used 11+ times
FREE Resource
9 Slides • 15 Questions
1
M5.L7 Counting Principle and Tree Diagram
Sprint/Exit Ticket Included

2
3
Multiple Choice

What is the percent represented in the model?
4
Multiple Choice
5
Fill in the Blank
6
Fill in the Blank
7
Multiple Select
8
Multiple Select
9
Multiple Choice

What is a sample space?
10

11

12
Multiple Choice
13
Multiple Choice
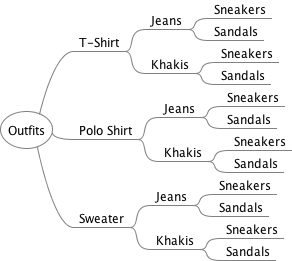
You have a 3 tops, 2 pants and 2 shoes. How many total outfit options are represented?
14

15
Multiple Choice
16

17
Multiple Choice

Use the tree diagram to find the probability of tossing a head first and then a tail when a coin is tossed twice.
18
Multiple Choice
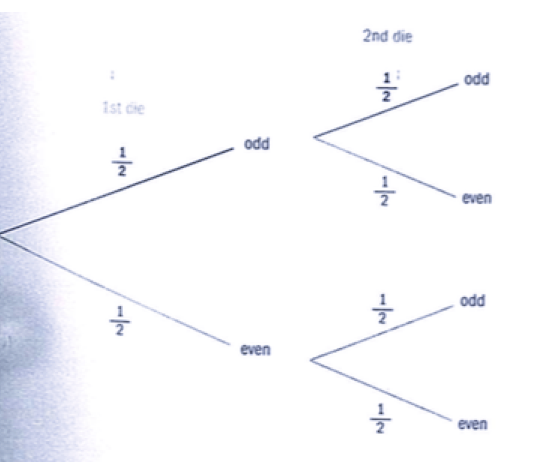
Two dice are rolled and it is recorded whether the result on each is odd or even. What is the probability both are odd?
19

20

21
22
Multiple Choice

What is the purpose of a tree diagram?
23
Multiple Choice
24
Multiple Choice

A store sells handbags in two colors: black and white. They are available in 2 different sizes: small and large. Which diagram shows every possible combination of the color and size of a bag that one can buy?
M5.L7 Counting Principle and Tree Diagram
Sprint/Exit Ticket Included
Show answer
Auto Play
Slide 1 / 24
SLIDE
Similar Resources on Wayground

20 questions
Subtracting Integers
Lesson
•
7th Grade
19 questions
Percents
Lesson
•
7th Grade
19 questions
MGSE7.NS.1
Lesson
•
7th Grade
20 questions
Integer Operations with Word Problems
Lesson
•
7th Grade
18 questions
Surface Area
Lesson
•
7th Grade
20 questions
Ratio's Rates
Lesson
•
7th Grade
20 questions
Writing Two Step Equations
Lesson
•
7th Grade
20 questions
One-Step Equations
Lesson
•
7th Grade
Popular Resources on Wayground
8 questions
Spartan Way - Classroom Responsible
Quiz
•
9th - 12th Grade
15 questions
Fractions on a Number Line
Quiz
•
3rd Grade
14 questions
Boundaries & Healthy Relationships
Lesson
•
6th - 8th Grade
20 questions
Equivalent Fractions
Quiz
•
3rd Grade
3 questions
Integrity and Your Health
Lesson
•
6th - 8th Grade
25 questions
Multiplication Facts
Quiz
•
5th Grade
9 questions
FOREST Perception
Lesson
•
KG
20 questions
Main Idea and Details
Quiz
•
5th Grade
Discover more resources for Mathematics
14 questions
Volume of rectangular prisms
Quiz
•
7th Grade
20 questions
Graphing Inequalities on a Number Line
Quiz
•
6th - 9th Grade
18 questions
Identifying Radius/Diameter
Quiz
•
7th Grade
20 questions
Complementary and Supplementary Angles
Quiz
•
7th Grade
15 questions
Area and Circumference of a Circle
Quiz
•
7th Grade
21 questions
Circumference of a Circle
Quiz
•
7th Grade
20 questions
Mean, Median, Mode and Range
Quiz
•
5th - 7th Grade
20 questions
Slope Intercept Form
Quiz
•
7th - 8th Grade