
bar graph and pictograph
Presentation
•
Mathematics
•
2nd Grade
•
Medium
Standards-aligned

yustina thabet
Used 85+ times
FREE Resource
1 Slide • 11 Questions
1
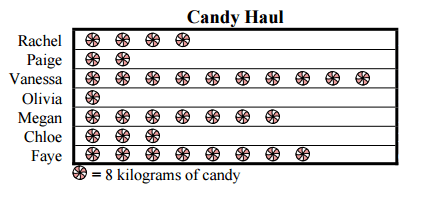
bar graph and pictograph

2
Multiple Choice

How many students like vanilla and chocolate?
3
Multiple Choice
4
Multiple Choice
5
Multiple Choice
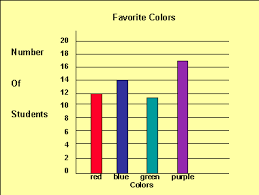
What type of graph is this?
6
Multiple Choice

How many people voted for red as their favorite color?
7
Multiple Choice
How many more people like red than purple?
8
Multiple Choice

How many more people scored a 100 than a 90?
9
Multiple Choice

How many total pizzas were sold by Peppers Pizza and Pizza house?
10
Multiple Choice

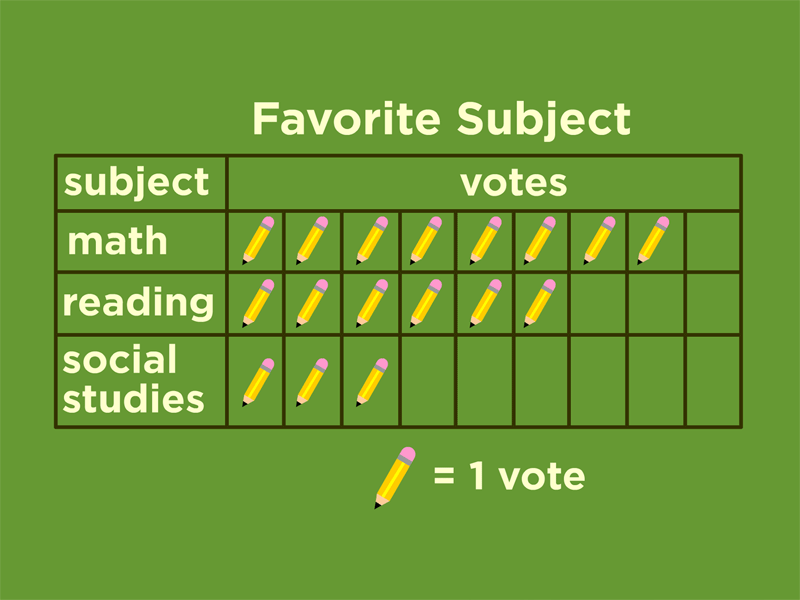
How many total votes were collected?
11
Multiple Choice

How many more students like Soccer than Basketball?
12
Multiple Choice

How many students like grape flavored popsicles?
bar graph and pictograph
Show answer
Auto Play
Slide 1 / 12
SLIDE
