
Math 5.9C - Graphs
Presentation
•
Mathematics
•
5th Grade
•
Medium
+11
Standards-aligned

Jaclyn Stoss
Used 124+ times
FREE Resource
6 Slides • 21 Questions
1
Math 5.9C
Graphs

2

3
Multiple Choice

Which is the most popular pet?
4
Multiple Choice

How many more people liked goldfish than snakes?
5
Multiple Choice

What is the frequency and how many tally marks should
cups have?
6
Multiple Choice

Complete the missing parts on a piece of paper. Which is the least common shoe size?
7

8
Multiple Choice
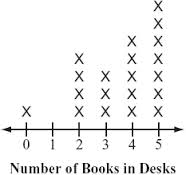
How many people have two or less books in their desk?
9
Multiple Choice

What is the difference between the highest score and the lowest score on the test?
10
Multiple Choice
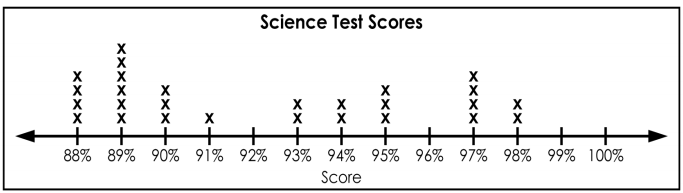
How many more students scored a 98 than scored a 88?
11
Multiple Choice

How many people drive SUVs?
12

13
Multiple Choice

Look at the Bar Graph, "Student Grades". What grade did the most students get?
14
Multiple Choice
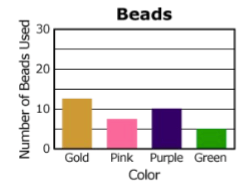
The graph shows the number of colored beads used to make a necklace. How many purple and green beads were used in all?
15
Multiple Choice
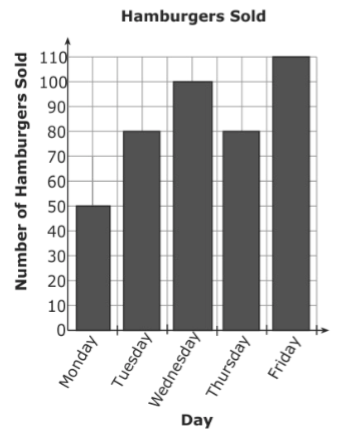
The bar graph shows the number of hamburgers sold at Bob’s Burger Shack. On which days were more than 80 hamburgers sold?
16
Multiple Choice

Mary is recording her plant's growth in a journal. How many inches has the plant grown from week 1 to 7?
17

18
Multiple Choice

How many scores are listed in this Stem and Leaf Plot?
19
Multiple Choice

Which point value occurs the most often?
20
Multiple Choice

This plot represents the number of seashells found at the beach by a group of students on a field trip. What is the total amount of seashells found on the beach by the students?
21
Multiple Choice

How many students scored more than 80%?
22
Multiple Choice

This plot show how many point was scored on a video game. What is the difference between the greatest and least amount of point scored?
23

24
Multiple Choice

Which ordered pair appears to represent a point on the scatter plot?
25
Multiple Choice

She displays the data on a scatter plot. About how much money was donated per day when 300 people visited the museum?
26
Multiple Choice
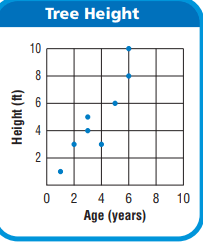
What is the age of the tree that is 8 feet tall?
27
Multiple Choice

Five cups of hot chocolate were sold when the temperature was 45 degrees Fahrenheit, . Which ordered pair shows this data on the scatter plot?
Math 5.9C
Graphs
Show answer
Auto Play
Slide 1 / 27
SLIDE
