Search Header Logo
  1. Resource Library
  2. Science
  3. Biology
  4. Ecology
  5. Ecology
Ecology

Ecology

Assessment

Presentation

Science

10th Grade

Practice Problem

Medium

NGSS
HS-LS2-2, MS-LS1-5, MS-LS2-3

+1

Standards-aligned

Created by

Melissa Guinta

Used 27+ times

FREE Resource

18 Slides • 5 Questions

1

Ecology

7.6-7.10

Slide image

2

3

Succession

Primary - Bare rock: starts with lichens (volcano, glacier)


Secondary - Soil present: starts with small annual plants (fires, clear cutting, climate change, introduced species)


Pioneer Species

Slide image

4

Slide image

Primary or Secondary Succession will happen here??

5

Multiple Choice

An ecosystem has experienced a flood. Which type of plants would you expect to see growing first after the flood?

1

Shrubs

2

Lichens

3

Small Annual Plants

6

Trophic Levels

Food Chain - plants bring insects, then small mammals, which bring?

Slide image

7

Slide image

Label Consumers vs Producers

8

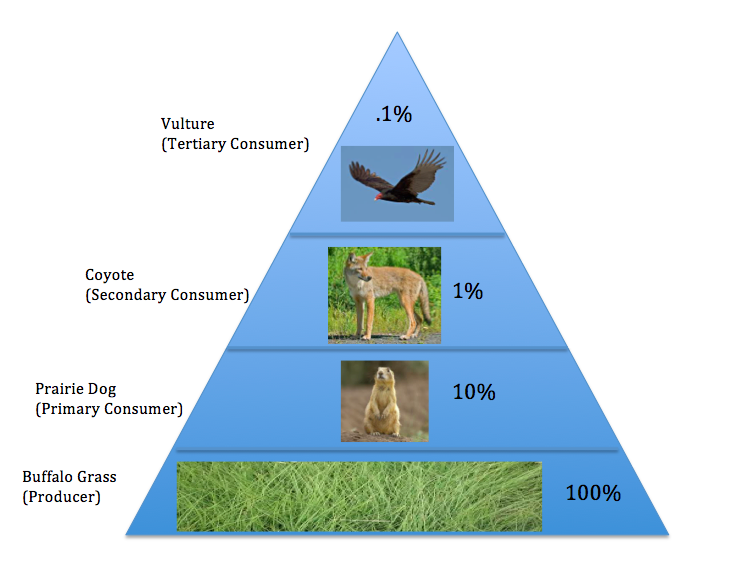
Energy Pyramid: Only 10% passed on, rest used or lost as heat

Slide image

9

A grass starts with 30,000 kJ of energy. How much energy would a cheetah acquire after it ate a zebra that consumed the grass?

  • 30 kJ

  • 300 kJ

  • 3000 kJ

10

Multiple Choice

What is the difference between food chains and food webs?

1

Food webs show flow of energy from producers to consumers, food chains show the flow of energy from consumers to producers.

2

Food chains show a single path of energy, and food webs show overlapping pathways of energy

11

Biodiversity - More species diversity means more health of an Ecosystem

  • Habitat Loss/Fragmentation

  • Poaching

  • Introducing New Species

  • Pollution

12

Limiting Factors Determine Carrying Capacity

Restrict Population Growth

Slide image

13

Density Dependent Limiting Factors

  • Disease

  • Parasites

  • Competition

  • Predation

14

Density Independent

Natural Disasters, Climate Change, Humans

Slide image

15

16

Population Density - number of individuals in a population per unit area

  • Growth = from Birth Rate + Immigration

  • Decrease = from Death + Emigration

  • (BR+I) - (DR+E) = Population Growth

  • Positive number = growth; Negative number = shrinking

17

Exponential Growth

Population grows at the same rate

Slide image

18

Open Ended

In a population of deer, the birth rate is 5, the death rate is 4, immigration is 8, and emigration is 6. Calculate the population growth by filling in the formula below.

(BR+I) - (DR+E) = Population Growth

19

Multiple Choice

A trout population grew from 4 in 1992 to 16 in 1993 and then to 64 in 1994. If it continued to grow exponentially, approximately how many trout were there in 1995?

1

100

2

128

3

256

20

Greenhouse Gases

Carbon Dioxide (burning fossil fuels)

Methane (livestock, landfills

Nitrous Oxide (sewage treatment, agriculture)

Slide image

21

Ballast Water - in ships 


carries invasive species into great lakes


causing a decrease in native species the Walleye


Slide image

22

Slide image

23

Multiple Choice

White perch is a fish that is native to Atlantic coastal regions and is invasive to the Great Lakes. It feeds on native species. What was most likely its mode of introduction?

1

trapped in a cargo crate carrying nonperishable items

2

produce brought from the eastern states

3

trapped in a ship's ballast or a water tank

Ecology

7.6-7.10

Slide image

Show answer

Auto Play

Slide 1 / 23

SLIDE