
Math 6 - MAD, IQR, and Data Distribution
Presentation
•
Mathematics
•
6th Grade
•
Medium
+3
Standards-aligned
Used 91+ times
FREE Resource
4 Slides • 30 Questions
1
Math 6 - MAD, IQR, and Data Distribution

2
3
Multiple Choice
4
Multiple Choice

5
Multiple Choice
6
Multiple Choice

7
Multiple Choice

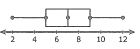
What is the interquartile range (IQR)?
8
Multiple Choice
9
Multiple Choice
10
11
Multiple Choice
12
Multiple Choice
13
Multiple Choice
14
Multiple Choice
15
Multiple Choice
16
Multiple Choice
17
Multiple Choice
18
Multiple Choice
19
Multiple Choice
20
Fill in the Blanks
21
Multiple Choice
22
Multiple Choice
23
Multiple Choice
24
Multiple Choice
25
26
Multiple Choice
27
Multiple Choice
28
Multiple Choice
29
Multiple Choice
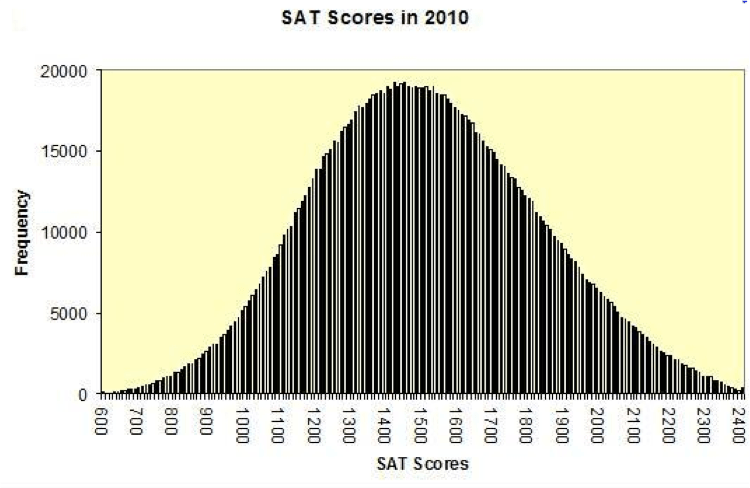
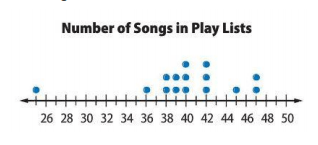
What is the shape of the distribution?
30
Multiple Choice

Where is the gap in the data?
31
Multiple Choice

Which statement best describes this graph?
32
Multiple Choice
Which statement best describes this graph?
33
Multiple Choice
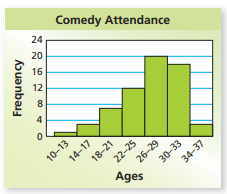
What is the shape of the data?
34
Multiple Choice
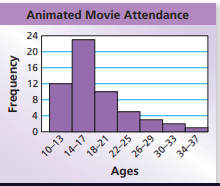
What is the shape of the data?
Math 6 - MAD, IQR, and Data Distribution
Show answer
Auto Play
Slide 1 / 34
SLIDE
