Search Header Logo
Statistics

Statistics

Assessment

Presentation

•

Mathematics

•

6th - 7th Grade

•

Medium

•
CCSS
6.SP.B.4, 6.SP.B.5C, 7.SP.A.1

+9

Standards-aligned

Created by

Jilisa Small

Used 17+ times

FREE Resource

52 Slides • 43 Questions

1

Statistics

Test Review

Slide image

2

Slide image

3

Slide image

4

Slide image

5

Slide image

6

Slide image

7

Slide image

8

Slide image

9

Slide image

10

Slide image

11

Slide image

12

Slide image

13

Multiple Choice

_______ is the entire group of objects or individuals considered for a survey.
1
Sample
2
Population
3
Random Sample
4
Quartile

14

Slide image

15

Slide image

16

Slide image

17

Slide image

18

Slide image

19

Slide image

20

Slide image

21

Slide image

22

Slide image

23

Multiple Choice

A student wants to know which type of pizza the students at his high school prefer. Which option would give a unbiased, representative sample:
1
Asking all the students in the hot lunch line.
2
Asking 10 random students from each homeroom.
3
Asking every other student who gets off a school bus.
4
Asking all the 10th graders.

24

Multiple Choice

A U.S. senator from Maine wants to find out the opinion of the voters in his state on issues concerning education.  The office of the senator sends out a survey to a random sample of registered voters in Maine.  Is this random sampling?
1
Yes
2
No

25

Multiple Choice

The manager of a book store surveys people who buy mystery novels to see if the store should expand its hours.  What is the population?
1
People who visit the bookstore.
2
People who buy mystery novels.
3
Residents of the town
4
People who like to read.

26

Multiple Choice

Biased or Random?


Isaac wants to find out the favorite foods of students at Churchill. He asks the boys’ basketball team about their favorite foods.

1

Biased sample

2

Random sample

27

Multiple Choice

Biased or Random?


Isaac wants to find out the favorite foods of students at Churchill. He asks the boys’ basketball team about their favorite foods.

1

Biased sample

2

Random sample

28

Multiple Choice

Question image

How many total students were surveyed about their number of brothers and sisters? (add up all of the dots)

1

15

2

10

3

6

29

Slide image

30

Slide image

31

Slide image

32

Slide image

33

Multiple Choice

Question image

What is the median of the data?

1

2

2

1

3

3

4

12

34

Multiple Choice

Question image

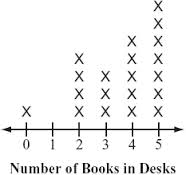
How many people have two or less books in their desk?

1

4

2

5

3

6

4

7

35

Multiple Choice

Question image
What is the highest score in the class?
1
88%
2
100%
3
13
4
98%

36

Multiple Choice

Question image

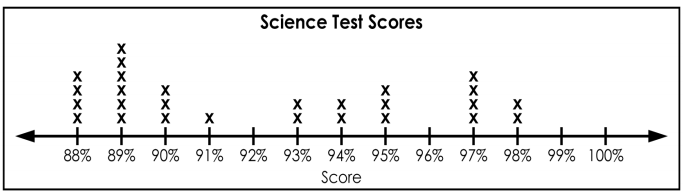
How many total students are in the science class?

1

13

2

6

3

27

4

25

37

Multiple Choice

Question image

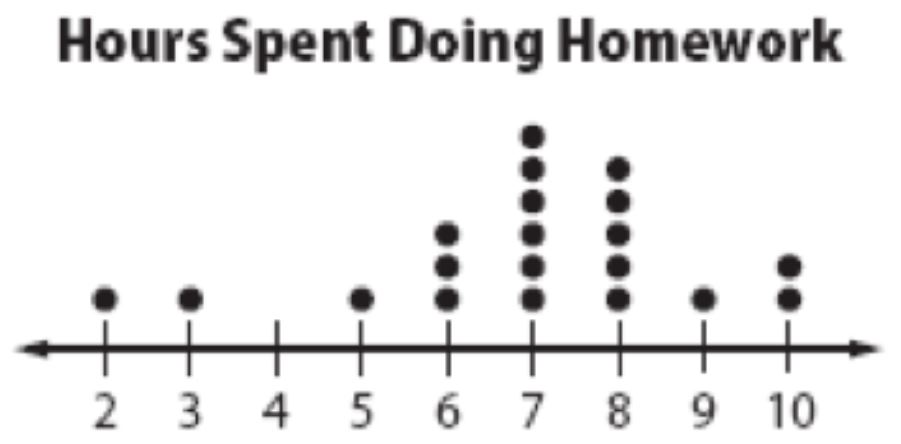
How many students spent 7 hours doing homework that week?

1

1

2

3

3

5

4

6

38

Multiple Choice

Question image

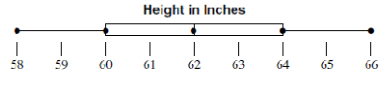
What is the RANGE of this data

1

40

2

95

3

90

4

100

39

Multiple Choice

Question image

What is the MEDIAN of this data

1

95

2

90

3

100

4

40

40

Slide image

41

Slide image

42

Slide image

43

Slide image

44

Slide image

45

Slide image

46

Slide image

47

Slide image

48

Slide image

49

Slide image

50

Slide image

51

Multiple Choice

The mode score on the 6th grade math test was 94! Which of these interpretations must be correct?
1
94 was the highest score on the test.
2
More students received a 94 than any other score
3
No student scored below a 94
4
A score of 91 was slightly below average.

52

Multiple Choice

The number of pages that Carolyn wrote in her journal each day from Monday to Friday is shown below: 
9, 8, 12, 6, 10
What is the mean number of pages she wrote per day?
1
5
2
6
3
9
4
11

53

Multiple Choice

What is the mode?
1
# happening the most
2
the average
3
biggest - smallest
4
the middle #

54

Multiple Choice

What is the range?
1
average
2
biggest-smallest
3
the middle #
4
# happening the most

55

Multiple Choice

To find the average or mean of a set of numbers, add up all the items and divide by...

1

2

2

The minimum

3

The maximum

4

The number of items

56

Multiple Choice

A data set can have more than one mode

1

True

2

False

57

Multiple Choice

A data set can have more than one median?

1

True

2

False

58

Multiple Choice

If you score 76, 85, 97, and 83 on your math tests, what would your median score be?

1

84

2

90

3

85

4

88

59

Multiple Choice

What is the mean of this set of data?

2, 15, 7

1

24

2

3

3

6

4

8

60

Multiple Choice

Question image
Students at Cooper Elementary school took a survey about what kinds of pets they had at home. Then, students plotted that information on a frequency table.
How many kids have dogs and cats for pets?
1
19
2
12
3
7
4
20

61

Multiple Choice

Find the median from the given set of data.

1, 2, 3, 4, 2, 3, 2, 3

1

2.5

2

4

3

5

4

1

62

Multiple Choice

Question image
What was the day with the least amount of cars sold? 
1
Monday
2
Tuesday
3
Wednesday
4
Thursday

63

Multiple Choice

Find the median of these numbers:
4,2,7,4,3
1
2
2
5
3
7
4
4

64

Multiple Choice

Ervin bowled 7 games last weekend. His scores are: 155, 165, 138, 172, 127, 193, 142. What is the range of Ervin's scores?

1

193

2

127

3

60

4

66

65

Multiple Choice

Find the median of the data set

9, 8, 7, 11, 7, 16, 3

1

8

2

7

3

3

4

2

66

Multiple Choice

What is the mode?
500, 600, 700, 800, 500, 600
1
500 and 600
2
700
3
800 and 700
4
500

67

Slide image

68

Slide image

69

Slide image

70

Slide image

71

Slide image

72

Slide image

73

Slide image

74

Slide image

75

Slide image

76

Slide image

77

Slide image

78

Slide image

79

Slide image

80

Slide image

81

Slide image

82

Slide image

83

Multiple Choice

Question image

What is the median test score on the 6TH Grade Math Test?

1

78

2

85

3

93

4

97

84

Multiple Choice

Question image
Find the Median
1
98
2
93
3
78
4
85

85

Multiple Choice

Which of the following best describes the process of finding the interquartile range for a set of data?
1
Add the biggest and smallest numbers.
2
Place the numbers in order from least to greatest and find the middle.
3
Find the difference between the maximum and the minimum.
4
Subtract Q1 from Q3.

86

Multiple Choice

Question image
What value is the lower quartile?
1
66
2
58
3
60
4
64

87

Multiple Choice

Question image
What data value is the upper quartile (Q3)?
1
64
2
62
3
66
4
58

88

Multiple Choice

Question image
What is the median of the data?
1
200
2
100
3
90
4
140

89

Multiple Choice

Question image
What is the interquartile range?
1
4
2
6
3
2
4
8

90

Multiple Choice

The difference between the upper and lower quartiles.

1

Inter-Quartile Range

2

Least Value

3

Median

4

Box Plot

91

Multiple Choice

Three values, one of which is the medians, that divide a data set into fourths.

1

Median

2

Inter-Quartile Range

3

Quartiles

4

Outlier

92

Multiple Choice

The middle number, or the mean (average) of the two middle numbers, in a set of ordered data.

1

Median

2

Mode

3

Greatest Value

4

Box Plot

93

Multiple Choice

A graphical display that shows how data are distributed by using the median, quartiles, least value, and greatest value.

1

Mode

2

Dot Plot

3

3rd Quartile

4

Box Plot

94

Multiple Choice

The difference between the greatest and least values in a data set

1

1st Quartile

2

Range

3

Median

4

Lower Extreme

95

Multiple Choice

Question image

What is the minimum value on this box plot?

1

52

2

54

3

56

4

63

Statistics

Test Review

Slide image

Show answer

Auto Play

Slide 1 / 95

SLIDE