Search Header Logo
  1. Resource Library
  2. Science
  3. Physics
  4. Graphing
  5. 1.4 Graphing
1.4 Graphing

1.4 Graphing

Assessment

Presentation

Science

8th Grade

Medium

NGSS
MS-PS3-1, MS-LS2-1, MS-ESS2-4

+2

Standards-aligned

Created by

Brooke Manley

Used 1+ times

FREE Resource

3 Slides • 19 Questions

1

1.4 Graphing

by Brooke Manley

2

​Types of Graphs

  • ​Line Graph

  • ​Bar Graph

  • ​Circle Graph

media

3

Multiple Choice

when you want to compare categories you use ________

1

Bar graph

2

Line graph

3

Pie chart

4

Multiple Choice

Question image
What type of graph is this?
1
Line Graph
2
Pictograph
3
Bar Graph
4
Histogram

5

Multiple Choice

Question image
What type of graph is this?
1
Bar graph
2
Histogram
3
Pie Chart
4
Stem Chart

6

Multiple Choice

Shows changes over time.

1

bar graph

2

Line graph

3

Pie chart

7

Multiple Choice

Shown as percentages %

1

Bar graph

2

Line graph

3

Pie chart

8

Multiple Choice

Question image
1

Bar graph

2

Line graph

3

Pie chart

9

Multiple Choice

Question image
How many more people like purple than red?
1
3
2
5
3
7
4
9

10

Multiple Choice

Question image
According to this graph, what is the most popular flavor of Jolly Rancher?
1
Cherry
2
Grape 
3
Blue Raspberry
4
Watermelon

11

Multiple Choice

Question image
People buy more drinks on ____ than any other day.
1
Monday
2
Tuesday
3
Thursday
4
Friday

12

​Creating a Graph

​Title

​X-axis label and scale

​Y-axis label and scale

​Plot Points

​Draw a Line

13

Multiple Choice

Question image
What label is along the y-axis in this graph?
1
Copyright 2007
2
Lines
3
Age in Years
4
Number of Teens

14

Multiple Select

Which variable should be on the x axis?

1

dependent variable

2

independent variable

3

control variable

15

Multiple Choice

Question image

The horizontal axis of a line graph is called the __________.

1

slope

2

line of best fit

3

x-axis

4

y-axis

16

Multiple Choice

Question image
What is the independent variable on the graph (x-axis)?
1
Metro Bicycle Shop Weekly Sales
2
Bicycles Sold
3
Types of Bicycles

17

Multiple Choice

Question image

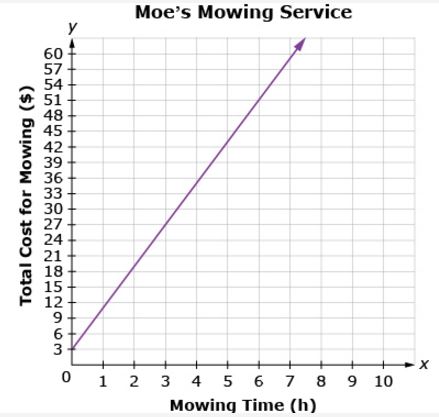
What is the label on the x-axis of this graph?

1

Number of visitors

2

Year

3

Visitors to a Park

18

Multiple Choice

Question image

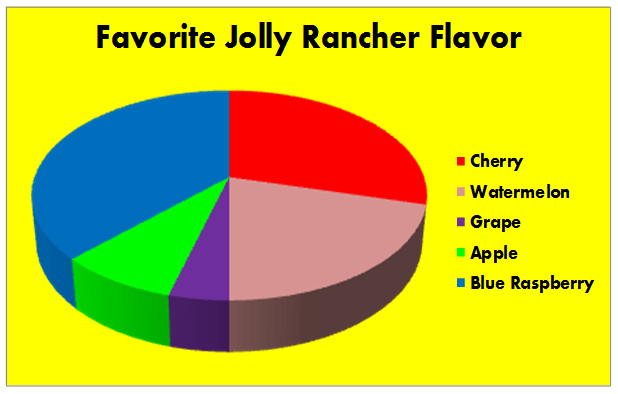
What is the title of the graph below?

1

Months

2

Inches

3

Average monthly rainfall

19

Multiple Choice

Question image

What is the dependent variable?

1

Type of fertilizer

2

Average plant height

3

The effect of fertilizer on plant height

4

The effect of plant height on fertilizer

20

Multiple Choice

Question image
What is the general trend of this line graph?
1
The more you mow, the less money you make.
2
You make the same amount of money regardless of how long you mow.
3
The more you mow, the more money you make.
4
Mowing is dangerous.

21

Multiple Choice

Question image

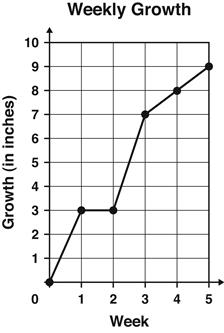
The graph shows the number of inches a plant grew each week.

Between which 2 weeks did the plant grow the MOST?

1

Week 1 and Week 2

2

Week 2 and Week 3

3

Week 3 and Week 4

4

Week 4 and Week 5

22

Multiple Choice

Question image
What is this graph missing?
1
Axes
2
Title
3
Categories
4
None of these

1.4 Graphing

by Brooke Manley

Show answer

Auto Play

Slide 1 / 22

SLIDE