
Motion Graphs - Honors
Presentation
•
Science
•
6th Grade
•
Medium
+1
Standards-aligned

Rebecca Smith
Used 4+ times
FREE Resource
10 Slides • 60 Questions
1
2

3
4

5

6
Multiple Choice
7
Multiple Choice
8
Multiple Choice

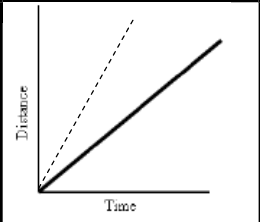
Describe the motion in the graph:
9
Multiple Choice

Describe the motion in the graph:
10
Multiple Choice

Describe the motion in the graph:
11
Multiple Choice

Describe the motion in the graph:
12
Multiple Choice

Describe the motion in the graph:
13
Multiple Choice
What does this graph represent?
14
Multiple Choice

What is happening at C?
15
Multiple Choice

16
Multiple Choice

17
Multiple Choice

The graph shows the movement of an object.
At 60 seconds, how far had this object traveled?
18
Multiple Choice

Segment A-B The bus is _________________.
19
Multiple Choice
Segment C-D The bus is _________________.
20
Multiple Choice
21
Multiple Choice

Edward drove 80 miles from his home to London.
He stopped and visited his friend Nicola on the way. Here is the distance-time graph for the journey.
How far was Edward from home when he visited Nicola?
22
23

24
Multiple Choice
25
Multiple Choice
26
Multiple Choice

When was Marie driving the fastest?
27
Multiple Choice

During what period of time was Marie stopped?
28
Multiple Choice

What could account for Marie’s motion at 27 minutes?
29
Multiple Choice

It usually takes Marie 30 minutes to get to work. Did her trip take...
30
Multiple Choice

How far away is Marie's work from her house?
31
Multiple Choice

Consider the graph shown below. Which description below is consistent with the graph?
32
Multiple Choice

What is the starting point of the object?
33
Multiple Choice

Which one of the following graphs describes an object that is moving at a constant speed to the left (- direction)?
34
Multiple Choice
Which one of the following graphs describes an object that is at rest?
35
Multiple Choice

Which one of the following graphs describes an object that is moving to the right and slowing down?
36
Multiple Choice
37
Multiple Choice
38
Multiple Choice
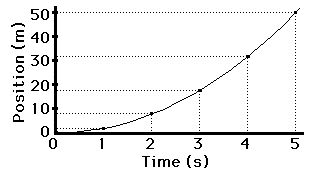
At 8 s what is the objects position?
39
Multiple Choice
40
41
42
43
Multiple Choice
44
Multiple Choice
45
Multiple Choice
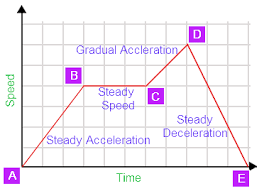
At what point is the speed the greatest?
46
Multiple Choice

What is happening during point C to D?
47
Multiple Choice
48
Multiple Choice
49
Multiple Choice

50
Multiple Choice

What is happening during point A to B?
51
Multiple Choice

52
Multiple Choice

53
Multiple Choice

54
Multiple Choice

55
Multiple Choice

56
Multiple Choice

57
Multiple Choice
During what period of time was Marie stopped?
58
Multiple Choice
When was Marie driving the fastest?
59
Multiple Choice
What could account for Marie’s motion at 27 minutes?
60
Multiple Choice

How does her speed at 3 minutes compare with her speed at 7 minutes?
61
Multiple Choice
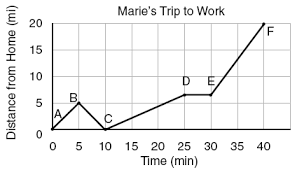
What could be a possible explanation for why Marie turned around at point B.
62
Multiple Choice

How far did Marie go before she turned around?
63
Multiple Choice
During what period of time was Marie stopped?
64
Multiple Choice
What could account for Marie’s motion at 27 minutes?
65
Multiple Choice
How does her speed at 3 minutes compare with her speed at 7 minutes?
66
Multiple Choice
It usually takes Marie 30 minutes to get to work. Did her trip take...
67
Multiple Choice
How far away is Marie's work from her house?
68
Multiple Choice
What could be a possible explanation for why Marie turned around at point B.
69
Multiple Choice
How far did Marie go before she turned around?
70
Multiple Choice

In Segment DE Marie was stopped at a red light. How long was she stopped for?
Show answer
Auto Play
Slide 1 / 70
SLIDE
