Search Header Logo
Lecture 9.3 - Descriptive Stats

Lecture 9.3 - Descriptive Stats

Assessment

Presentation

Mathematics

6th - 12th Grade

Easy

CCSS
6.SP.B.5C, 6.SP.B.4, 7.NS.A.1C

+3

Standards-aligned

Created by

Gabe Geering

Used 3+ times

FREE Resource

5 Slides • 32 Questions

1

Lecture 9.3 - Descriptive Stats

G

2

3

Univariate Data

→ data with one variable such as test scores

→ four ways to measure univariate data

  • mean - "the average" or the sum of numbers divided by the amount of numbers

  • median - the middle positioned number in ascending order

  • mode - the most common number

  • range​ - smallest number subtracted from the largest

Don't you love one less variable?

4

Multiple Choice

________________ data is data that deals with two variables.

1

Univariate

2

Bivariate

3

Categorical

4

Quantitative

5

Multiple Choice

________________ data is data that deals with one variable.

1

Univariate

2

Bivariate

3

Categorical

4

Quantitative

6

Multiple Choice

Is the following situation an example of univariate or bivariate data; Icy-pops sold and the temperature of the day recorded by a shopkeeper.

1

Univariate Data

2

Bivariate Data

7

Multiple Choice

Is the following situation an example of univariate or bivariate data;Which artists sold the most records this year?

1

Univariate Data

2

Bivariate Data

8

Multiple Choice

Is the following situation an example of univariate or bivariate data;The amount of calories someone burns and the hours they exercise.

1

Univariate Data

2

Bivariate Data

9

Multiple Choice

Is the following situation an example of univariate or bivariate data;Which sport is most popular in Floral Park Memorial High school?

1

Univariate Data

2

Bivariate Data

10

Multiple Choice

Mean:
1   2   3   4   5   6
1
2.5
2
3
3
3.5
4
4

11

Multiple Choice

Median:
0   1   2   3   4
1
1
2
2
3
3
4
4

12

Multiple Choice

Mode:
0   1   1   2   3   4
1
1
2
2
3
3
4
4

13

Multiple Choice

Range:
67, 74, 95, 98, 98, 99, 102
1
102
2
67
3
98
4
35

14

Multiple Choice

Mean:
67, 74, 95, 98, 98, 99, 102
1
90.4
2
633
3
98
4
92.3

15

Multiple Choice

Median:
67, 74, 95, 98, 98, 99, 102
1
102
2
67
3
98
4
90.4

16

Multiple Choice

Mode:
67, 74, 95, 98, 98, 99, 102
1
90.4
2
35
3
92
4
98

17

Multiple Choice

Range:
10   12   13   15   16.5
1
6.5
2
13
3
66.5
4
13.3

18

Five Number Summary

→ used to summarize quantitative data or data with numbers

  1. minimum - smallest number

  2. maximum - largest number

  3. median - the middle

  4. quartiIe 1 (Q1) - middle of the lower half of numbers

  5. quartile 3 (Q3) - middle of the upper half of numbers​

It's like a $5 foot long, but better because it's math

19

Multiple Choice

Which of the following lists all parts of the five number summary?
1
Mean, Median, Mode, Range, and Total
2
Minimum, Quartile 1, Median, Quartile 3, and Maximum 
3
Smallest, Q1, Q2, Q3, and Q4
4
Minimum, Maximum, Range, Mean, and Median

20

Multiple Choice

What is the minimum of the data set: 2, 7, 8, 3, 9, 8, 12

1

3

2

2

3

12

4

0

21

Multiple Choice

What is the maximum of the data set; 2, 7, 8, 3, 9, 8, 12

1

2

2

9

3

18

4

12

22

Multiple Choice

What is the median (2nd Quartile) of this data set:

2, 7, 8, 3, 9, 8, 12

1

3

2

8

3

9

4

none

23

Multiple Choice

What is the the 1st Quartile of the data set: 2, 7, 8, 3, 9, 8, 12

1

3

2

8

3

2

4

12

24

Multiple Choice

What is the 3rd Quartile of the data set: 2, 7, 8, 3, 9, 8, 12

1

3

2

7

3

9

4

12

25

→ a visual to represent the five number summary

​​

​→ IQR: interquartile range

"the box"​ = Q3 - Q1​

Box plots can be graphed vertically, but the visual aesthetic of horizontal is just so peaceful. That's just me.

Box Plots

media

26

Multiple Choice

Roger bowled 7 games last weekend. His scores are: 155, 165, 138, 172, 127, 193, 142. What is Roger's median score?
1
127
2
155
3
156
4
193

27

Multiple Choice

Question image
What is the median of the data?
1
200
2
100
3
90
4
140

28

Multiple Choice

Question image
What is the maximum value?
1
58
2
66
3
64
4
60

29

Multiple Choice

Question image
What is the minimum value?
1
64
2
58
3
66
4
60

30

Multiple Choice

Question image
50% of the Cruisers attended between 7 and 16 car shows.  True or False?
1
True
2
False

31

Multiple Choice

Question image
What is the IQR of the Car Hops?
1
4
2
6

32

Multiple Choice

Question image
What is the interquartile range?
1
4
2
6
3
2
4
8

33

Multiple Choice

Question image
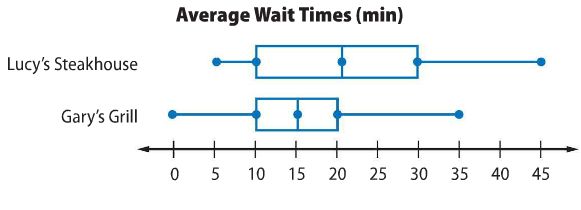
Which restaurant has a higher median wait time?
1
Lucy's Steakhouse
2
Gary's Grill
3
They are the same

34

Multiple Choice

Question image
What data value is the upper quartile (Q3)?
1
64
2
62
3
66
4
58

35

Multiple Choice

Question image
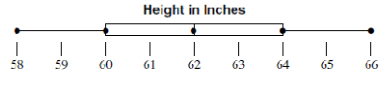
What value is the lower quartile?
1
66
2
58
3
60
4
64

36

Draw

Represent the univariate data set as a box plot:

24, 31, 31, 35, 38, 44, 45, 45, 48, 51, 55, 56

Provide a 5 number summary within the graph!

37

Draw

Represent the univariate data set as a box plot:

12, 15, 16, 20, 22, 25, 29, 30, 31

Provide a 5 number summary within the graph!

Lecture 9.3 - Descriptive Stats

G

Show answer

Auto Play

Slide 1 / 37

SLIDE