
Review for Statistics Test
Presentation
•
Mathematics
•
6th - 9th Grade
•
Medium
•
CCSS
6.SP.B.5C, 6.SP.B.4, HSS.ID.A.3
+1
Standards-aligned

Mary Salamone
Used 32+ times
FREE Resource
11 Slides • 10 Questions
1

2
3

4
Multiple Choice
5
Multiple Choice
6
Multiple Choice

What is the MEAN for this data?
7

8
Multiple Choice
9
Multiple Choice
10
11

12

13

14

15

16
Multiple Choice
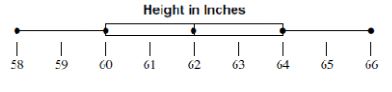
What data value is the upper quartile (Q3)?
17
Multiple Choice

The median of 2nd period class is less than the median of 1st period
class.
18
Multiple Choice

The median for 1st period class is the same to Q1 in 2nd
period class.
19
Multiple Choice

The IQR is 10 for 2nd period.
20


21
Multiple Choice

What is the range for this data set? Remember to subtract the minimum value from the maximum value.
Show answer
Auto Play
Slide 1 / 21
SLIDE
