Search Header Logo
  1. Resource Library
  2. Math
  3. Probability And Statistics
  4. Tree Diagrams
  5. Tree Diagrams Probability
Tree Diagrams- Probability

Tree Diagrams- Probability

Assessment

Presentation

Mathematics

7th Grade

Medium

CCSS
7.SP.C.8B

Standards-aligned

Created by

Ashley Carson

Used 67+ times

FREE Resource

6 Slides • 5 Questions

1

Tree Diagrams- Probability

By Ashley Carson

2

Tree Diagram

A tree diagram is a branching structure that maps the outcomes of chances/probabilities. The more branches, the more outcomes.

3

Tree Diagram

Flipping a coin. Your only outcomes are either head or tail. Your tree diagram would look like this:

media

4

Tree Diagram

Flipping a coin twice. If you flipped your coin a second time, you still only have the outcomes heads and tails but this time they branched out from your previous outcome. So your tree diagram would look like this:

media

5

media

6

Multiple Choice

Question image

What is the probability of getting 2 tails?

1

1/4

2

2/4

3

3/4

4

4/4

7

Tree Diagram

  • Can be used to show a sample space

  • Each "branch" of the diagram represents one possible outcome

media

8

Multiple Choice

Question image

What is the probability of making both shots?

1

1/4

2

2/4

3

3/4

4

4/4

9

Multiple Choice

Question image

How many possible outcomes or combinations can we get if we toss a coin, and roll a number cube?

1

6 total outcomes

2

8 total outcomes

3

14 total outcomes

4

12 total outcomes

10

Multiple Choice

Question image

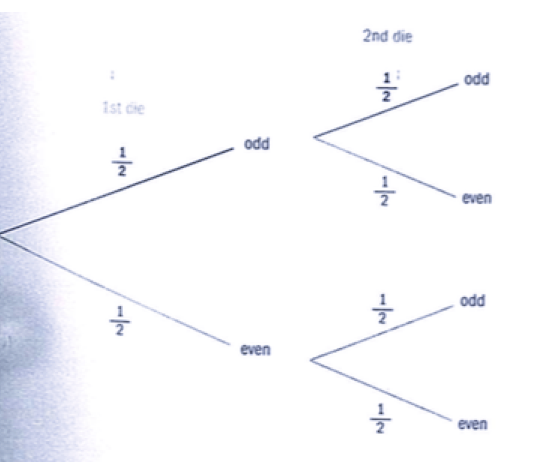
Two dice are rolled and it is recorded whether the result on each is odd or even. What is the probability both are odd?

1

1/4

2

1/2

3

2/4

4

3/4

11

Multiple Choice

Question image

The probability of getting Broccoli and fish for dinner is:

1

0.5

2

0.15

3

0.7

4

1

Tree Diagrams- Probability

By Ashley Carson

Show answer

Auto Play

Slide 1 / 11

SLIDE