
Scatter Plots, Linear Regression, Correlation Coefficient
Presentation
•
Mathematics
•
7th - 9th Grade
•
Medium
+7
Standards-aligned
Shalynne Orth
Used 79+ times
FREE Resource
11 Slides • 20 Questions
1
Scatter Plots, Linear Regression, Correlation Coefficient
By Shalynne Orth
2
3
4
5
6
Multiple Choice
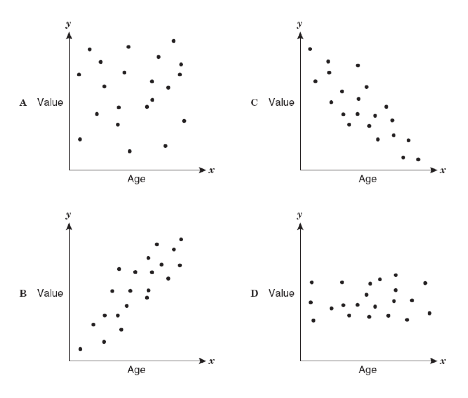
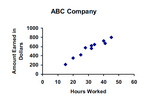
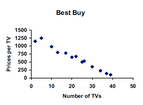
What type of association does this graph have?
positive
negative
none
all of the above
7
Multiple Choice
8
Multiple Choice
What is the correlation?
Negative correlation
No correlation
Positive correlation
All of the above
9
Multiple Choice
10
Multiple Choice
11
Multiple Choice
12
Why linear regression?
Use linear regression to predict the outcome of a progression using a given set of data.
We do this by finding the line of best fit for a set of data points.
13
Multiple Choice
14
Multiple Choice
15
Multiple Choice
If x is temperature and y is coffee sales, use the following formula to determine the coffee sales on a 34° day.
y = -60x+6443
$4403
$4673
$8483
$6443
16
How to find a linear regression equation:
Enter the table of values into desmos
On the next line, type EXACTLY this: y_1~mx_1+b
Desmos will tell the value of m and b!
17
Find the linear regression equation for the data set:
Click the plus sign on www.desmos.com
Click "table"
Enter the values
On the next line under the table, type y_1=mx_1+b
Desmos will give you m and b. Plug them into y=mx+b to get your equation!
^Equation is y=3x-1
18
Multiple Choice
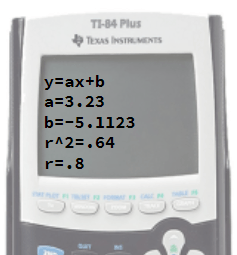
Write the equation for the linear regression shown.
y=−5.11x+3.23
r=0.8
y=3.23x − 5.11
y=0.64x+0.8
19
Multiple Choice
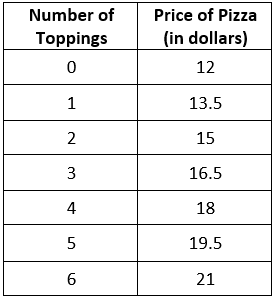
A restaurant sells pizza for the prices in the data table. Calculate the linear regression equation of the data.
y = 1.5x + 12
y = 12x + 1.5
y = 0.67x - 8
y = -8x + 0.67
20
Multiple Choice
21
So...What is the r value that desmos gives us?
The r value means correlation coefficient. It tells us how well the line of best fit actually fits the data.
r will be a number between -1 and 1
If r>0, it's POSITIVE correlation.
If r<0, it's NEGATIVE correlation.
If r is closer to 1 or -1, it's STRONG correlation (fits really well!)
If r is closer to 0, it's WEAK correlation (does not fit well)
22
In the example we did previously, r=1. (Don't worry about r^2.)
This means the line of best fit is a PERFECT fit. (It touches every single points right through the middle).
23
Study Time and Grades
As study hours increase, grades increase. There is a positive correlation between hours and grades.
So....Do hours spent studying cause higher grades? Likely, yes!
24
Multiple Choice
Estimate the correlation coefficient for this scatterplot.
A) r = 1.2
B) r = 0.89
C)r = 0
D) r = -0.89
25
Multiple Choice
Estimate the correlation coefficient for this scatterplot.
A) r = -0.9
B) r = 1
C) r = 0.9
D) r = -1
26
Multiple Choice
As x increases, y increases
A) correlation coefficient
B) causation
C) positive correlation
D) negative correlation
27
Multiple Choice
As x increases, y decreases.
A) no correlation
B) negative correlation
C) correlation coefficient
D) positive correlation
28
Multiple Choice
Average fat intake per citizen of a country and average cancer rate of a country. r=.73
strong positive
strong negative
weak positive
weak negative
29
Multiple Choice
Temperature of a rubber band and distance the rubber band can stretch. r=.84
strong positive
strong negative
weak positive
weak negative
30
Multiple Choice
Score on science exam and number of words written on the essay question. r=.28
strong positive
strong negative
weak positive
weak negative
31
Multiple Choice
Average time spent listening to music per day and average time spent watching TV per day. r=−.17
strong positive
strong negative
weak positive
weak negative
Scatter Plots, Linear Regression, Correlation Coefficient
By Shalynne Orth
Show answer
Auto Play
Slide 1 / 31
SLIDE
Similar Resources on Wayground
26 questions
X & Y Intercepts
Lesson
•
7th - 9th Grade
24 questions
Interpreting Linear Graphs
Lesson
•
8th Grade
24 questions
Notes Systems of Equations Graphing
Lesson
•
8th Grade
25 questions
Unit 2 Review
Lesson
•
7th - 8th Grade
23 questions
Solving Linear Equations With a Single Variable
Lesson
•
8th Grade
26 questions
Scatterplots Lesson and Quiz
Lesson
•
8th Grade
22 questions
Percent Proportion
Lesson
•
6th - 10th Grade
25 questions
Christmas science
Lesson
•
7th - 9th Grade
Popular Resources on Wayground
10 questions
5.P.1.3 Distance/Time Graphs
Quiz
•
5th Grade
10 questions
Fire Drill
Quiz
•
2nd - 5th Grade
20 questions
Equivalent Fractions
Quiz
•
3rd Grade
15 questions
Hargrett House Quiz: Community & Service
Quiz
•
5th Grade
20 questions
Main Idea and Details
Quiz
•
5th Grade
20 questions
Context Clues
Quiz
•
6th Grade
20 questions
Inferences
Quiz
•
4th Grade
15 questions
Equivalent Fractions
Quiz
•
4th Grade
Discover more resources for Mathematics
14 questions
Volume of rectangular prisms
Quiz
•
7th Grade
15 questions
Pythagorean Theorem Word Problems Quizizz
Quiz
•
8th Grade
16 questions
Simple Probability
Quiz
•
7th Grade
22 questions
Simple Probability
Quiz
•
7th Grade
20 questions
Graphing Inequalities on a Number Line
Quiz
•
6th - 9th Grade
10 questions
Exploring Basic Probability Concepts
Interactive video
•
6th - 10th Grade
73 questions
Math 8 Benchmark Review
Quiz
•
8th Grade
20 questions
Pythagorean Theorem Review
Quiz
•
8th Grade