
Interpret Line Plots
Presentation
•
Mathematics
•
4th - 5th Grade
•
Medium
•
CCSS
2.MD.D.9, 4.MD.B.4, 3.MD.B.4
+3
Standards-aligned

Paul Husch
Used 14+ times
FREE Resource
13 Slides • 11 Questions
1
2

3

4

5

6

7

8
Fill in the Blanks

Type answer...
9
Fill in the Blanks

Type answer...
10
Fill in the Blanks

Type answer...
11
Fill in the Blanks

Type answer...
12

13

14

15

16

17

18
Multiple Choice

1) If you put all the pencils together end to end what would be the total length of all the pencils?
19
Multiple Choice

Which list of data represents the data on the line plot?
20
Multiple Choice

How many days did it snow MORE than 4/8 of an inch?
21
Multiple Choice

How many students received a score in the 80's?
22
Multiple Choice
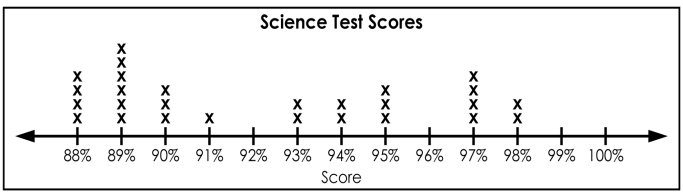
How many students scored 93% or less?
23
Multiple Choice

24
Multiple Choice

What is the total number of hours represented on the line plot below?
Show answer
Auto Play
Slide 1 / 24
SLIDE
