Search Header Logo
  1. Resource Library
  2. Math
  3. Data And Graphing
  4. ...
  5. Box Plots
Box Plots

Box Plots

Assessment

Presentation

Mathematics

6th Grade

Practice Problem

Medium

CCSS
6.SP.B.4, 6.SP.B.5C, 5.G.A.2

+1

Standards-aligned

Created by

Kaylie Eckhout

Used 1K+ times

FREE Resource

6 Slides • 11 Questions

1

Box Plots

By Kaylie Eckhout

2

media

Box plots are a way of representing the spread of data.

Some text here about the topic of discussion.

3

media

How to read a box plot

​Minimum or smallest value

Maximum or largest value

​Range of data= Maximum-Minimum

4

Multiple Choice

Question image

What is the range of math quiz results from Mrs. Sanchez's class?

1

75

2

20

3

95

4

60

5

media

How to read a box plot

​median of all data

6

Multiple Choice

Question image

What is the median of math quiz results from Mrs. Sanchez's class?

1

50

2

63

3

70

4

75

7

media

How to read a box plot

​Lower Quartile Q1

​Upper Quartile Quartile Q3

​25%

​25%

​25%

​25%

8

Multiple Choice

Question image

What percentage of scores were between 20 and 30?

1

0%

2

25%

3

50%

4

75%

9

Multiple Choice

Question image

What percentage of scores were between 30 and 70?

1

0%

2

25%

3

50%

4

75%

10

Multiple Choice

Question image

What percentage of scores were between 63 and 70?

1

0%

2

25%

3

50%

4

75%

11

media

How to read a box plot

​Interquartile

​Interquartile Range:

Q3-Q1​

​Q1

​Q3

12

Multiple Choice

Question image

What is the interquartile range of these scores?

1

50

2

70

3

40

4

30

13

Multiple Choice

Question image
What is the median?
1
62
2
58
3
66
4
60

14

Multiple Choice

Question image
What is the interquartile range (IQR)?
1
4
2
64
3
60
4
8

15

Multiple Choice

Question image
What percentage of the data is between 90 and 140?
1
25 %
2
50%
3
75%
4
100%

16

Multiple Choice

Question image
What is the minimum value?
1
64
2
58
3
66
4
60

17

Multiple Choice

Question image
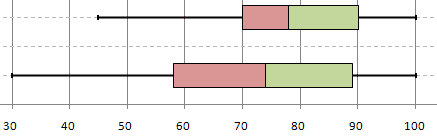
Which box and whisker plot has the highest median?
1
Top plot
2
Bottom plot

Box Plots

By Kaylie Eckhout

Show answer

Auto Play

Slide 1 / 17

SLIDE