Search Header Logo
  1. Resource Library
  2. Math
  3. Data And Graphing
  4. ...
  5. Data Displays
Data Displays

Data Displays

Assessment

Presentation

Mathematics

6th Grade

Medium

CCSS
6.SP.B.4, 3.MD.B.3, 6.SP.B.5C

+4

Standards-aligned

Created by

Folasade Adeoye

Used 12+ times

FREE Resource

9 Slides • 26 Questions

1

Data Displays

Histograms, Stem and Leaf plots, and Dot Plots​

By Folasade Adeoye

2

media

​PART 1

Histograms

3

4

media

5

Multiple Choice

Question image

How many people at the bowling alley were ages 6 to 25

1

12

2

5

3

7

4

16

6

Fill in the Blanks

media image

Type answer...

7

Multiple Choice

Question image

between what ages were the least amount of people at the bowling alley?

1

6-15

2

16-25

3

26-35

4

36-45

8

Multiple Choice

Question image

How many times did she practice for at least 45 minutes?

1

6

2

7

3

9

4

12

9

Multiple Choice

Question image

How many times did she practice for less than 30 minutes?

1

13

2

9

3

12

4

17

10

Stem & Leaf Plots

media

11

12

Open Ended

Question image

How many data points?

13

Open Ended

Question image

How many scored MORE THAN 33 free throws?

14

Open Ended

Why is a key important when reading a stem and leaf plot?

15

Multiple Choice

Question image

How many scored 25 or less free throws?

1

2

2

5

3

7

16

Multiple Choice

Question image

What is the highest ticket price?

1

$35

2

$12

3

$49

4

$40

17

Multiple Choice

Question image

What is the range in ticket prices?

1

$38

2

$37

3

$28

4

$31

18

Open Ended

Question image

How could we calculate the median ticket price?

19

Multiple Choice

Question image

What is the median ticket price?

1

$8

2

$5

3

$33

4

$35

20

Multiple Choice

Question image

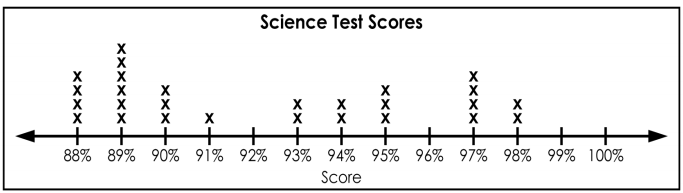
What is the MODE of the math test scores?

1

90

2

0

3

92

4

84 and 85

21

Multiple Choice

Question image

How many lunches cost less than $5.90?

1

2

2

3

3

4

4

7

22

Statistical Questions and Dot Plots

media

23

24

Multiple Choice

Question image

What is the range of the dot plot?

1

9

2

8

3

3

4

4

5

0

25

Dot Plots

Each dot represents one answer. In the sheet to the right, 3 students answered that they had 0 cookies at lunch. 5 said they had 2 cookies.

media

26

Multiple Choice

Question image

What is the outlier for this data?

1

90

2

96

3

102

4

108

27

Multiple Choice

Question image

How many students took the quiz? (count the dots)

1

15

2

20

3

12

4

17

28

Multiple Choice

Question image
How many students received a score of 94%? 
1
94
2
4
3
1
4
2

29

Multiple Choice

Question image

What is the outlier for this data?

1

90

2

96

3

102

4

108

30

Multiple Choice

Question image

What is the median of the data?

1

2

2

1

3

3

4

12

31

Multiple Choice

Question image
What is the MEDIAN of this data?
1
65
2
40
3
915
4
13

32

Multiple Choice

Question image
What is the range of the test scores?
1
15
2
100
3
6
4
10

33

Multiple Choice

Question image
What is the MODE of this data?
1
90
2
85, 90, and 95
3
85 and 95
4
None

34

Multiple Choice

Question image

What is the highest score in the class?

1

88%

2

100%

3

13

4

98%

35

Poll

Question image

HOW ARE YOU FEELING WITH DATA AND GRAPHS

GIRL, I GOT THIS!

I'M DOING PRETTY GOOD.

I KIND OF GET THIS, BUT I WOULD LIKE MORE PRACTICE

Data Displays

Histograms, Stem and Leaf plots, and Dot Plots​

By Folasade Adeoye

Show answer

Auto Play

Slide 1 / 35

SLIDE