Search Header Logo
Probability & Statistics_Continuous Distributions_5/3

Probability & Statistics_Continuous Distributions_5/3

Assessment

Presentation

Mathematics

10th - 12th Grade

Hard

CCSS
HSS.ID.A.4, 6.SP.B.4, HSF-LE.A.1B

+2

Standards-aligned

Created by

Sam R

Used 2+ times

FREE Resource

17 Slides • 17 Questions

1

media

2

media

3

media

4

media

5

media

6

Multiple Choice

The number of orange Skittles in a bag. 
1
Discrete
2
Continuous

7

Multiple Choice

The number of suitcases lost by airlines. 
1
Discrete
2
Continuous

8

Multiple Choice

The time it takes for a light bulb to burn out. 
1
Discrete
2
Continuous

9

Multiple Choice

While driving to Florida, Sophia averaged 72 m.p.h. 
1
Discrete
2
Continuous

10

media

11

media

12

media

13

Open Ended

Question image

Use the density graph shown here to answer the following questions:

1) What is P(X>3)?

2) What is P(X<3)?

14

media

15

media

16

media

17

media

18

Multiple Choice

What shape is a normal distribution curve?
1
Half curve
2
Round curve
3
Bell curve
4
Square curve

19

Multiple Choice

What is the the total area under the standard normal distribution curve?
1
100
2
25
3
.5
4
1

20

Multiple Choice

Which is NOT true about the normal distribution curve?

1

It is bell-shaped.

2

The mean, median, and mode are approximately equal

3

The smaller the standard deviation, the less spread in the curve.

4

It is asymmetrical.

21

media

22

Multiple Choice

According to the empirical rule, what percentage of data falls within 1 standard deviation? 
1
25%
2
68%
3
95%
4
99.7%

23

Multiple Choice

According to the empirical rule, how much of the data falls within 3 standard deviations? 
1
25%
2
68%
3
95%
4
99.7%

24

Multiple Choice

Question image
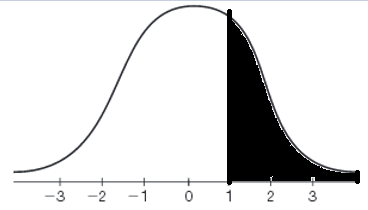
1.  Which best describes the shaded part of this normal distribution graph?  
1
All data that is one or higher.
2
All data that is one or more standard deviations above the mean.
3
All data that is between 1 and 3.
4
All data that is above the mean.

25

Multiple Choice

What is the Normal Range (68%) of the annual precipitation for Phoenix, if the average is 29 with a standard deviation of 3?
1
26-32
2
3-29
3
26-29
4
39-32

26

media

27

media

28

Multiple Choice

Use the following information and the Empirical Rule to estimate the answer.


The ages of golfers are normally distributed, with a mean of 38 and a standard deviation of 4.


Find the percentage of golfers that are between 30 and 46 years old.

1

68%

2

94%

3

95%

4

99.7%

29

Multiple Choice

Use the following information and the Empirical Rule to estimate the answer.


The ages of golfers are normally distributed, with a mean of 38 and a standard deviation of 4.


There are 500 golf members at the Mathy Country Club. How many are younger than 34?

1

16

2

80

3

100

4

150

30

Multiple Choice

The shelf life of a particular dairy product is normally distributed with a mean of 12 days and a standard deviation of 3 days.

About what percent of the products last between 12 and 15 days?
1
68%
2
34%
3
16%
4
2.5%

31

Multiple Choice

Given a mean of 75 and a standard deviation of 7, what percentage of scores are above 82?

1

34%

2

81.5%

3

16%

4

2.5%

32

Multiple Choice

Given a mean of 75 and a standard deviation of 7, how many students out of 500 would score between 68 and 82

1

11

2

2

3

340

4

498

33

media

34

If you finish early....

  • Complete any remaining Unit 9 Assignments (9.4.1 Practice or 9.4.4 Test)

  • Complete 10.3.1 Study & 10.3.3 Continuous Variable Quiz

  • Complete 10.2.1 Study & 10.2.3 Normal Distribution Quiz​

  • Finish any missing/late work.​

Some text here about the topic of discussion

media

Show answer

Auto Play

Slide 1 / 34

SLIDE