Search Header Logo
Presenting and interpreting data

Presenting and interpreting data

Assessment

Presentation

Mathematics

7th - 9th Grade

Medium

CCSS
RL.8.7, 2.MD.D.9, 6.RP.A.3C

+11

Standards-aligned

Created by

Ngoc Anh

Used 4+ times

FREE Resource

11 Slides • 29 Questions

1

Presenting and interpreting data

By Ngoc Anh

2

media

3

media

4

Multiple Choice

Question image

How many students participated in the survey?

1

50 students

2

40 students

3

30 students

4

20 students

5

Multiple Choice

Question image

720 people joined the survey.

How many people like Dogs the most?

1

240

2

80

3

220

4

120

6

Multiple Choice

Question image

The pie chart shows the colours of 32 beads. How many green beads are there?

1

90

2

8

3

11

4

9

7

media

8

media

9

media

10

Multiple Choice

25% of a circle is equal to:

1

one-fifth

2

a quarter

3

a half

4

two fifth

11

Multiple Choice

Question image

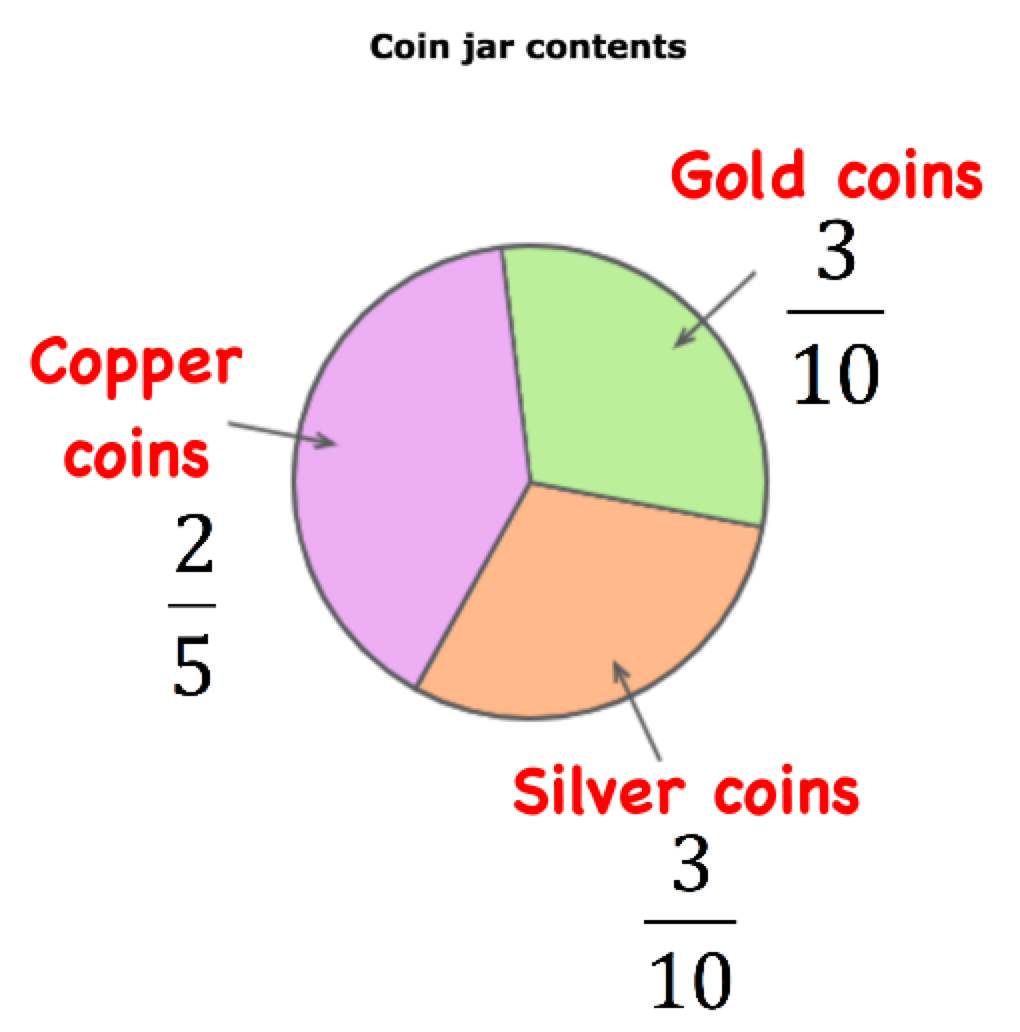
If there were 70 coins in the jar, how many of the coins are gold?

1

2

2

233

3

21

4

10

12

Multiple Choice

Question image

There are 360 animals total. How many are NOT fish?

1

40

2

300

3

320

4

280

13

Multiple Choice

Question image

There are 700 dogs. How many animals are there total?

1

1400

2

2100

3

1800

4

1100

14

Multiple Choice

Question image

What percent of the annual sales were washers?

1

20%

2

30%

3

25%

4

0.20%

15

Multiple Choice

Question image

How many degrees do the Peach, Banana and Pineapple take up of the pie chart?  

1

60°60\degree

2

120°120\degree  

3

190°190\degree  

4

216°216\degree  

16

Multiple Choice

Question image

There are 200 peaches. How many oranges are there?

1

230

2

260

3

130

4

360

17

Multiple Choice

Question image

There are 600 bananas. How many more Pineapples are there than peaches?

1

400

2

200

3

100

4

150

18

Multiple Choice

Question image

What is the modal fruit in this chart?

1

Banana

2

Pineapple

3

Graphes

4

Orange

5

Peach

19

media

20

Multiple Choice

Question image

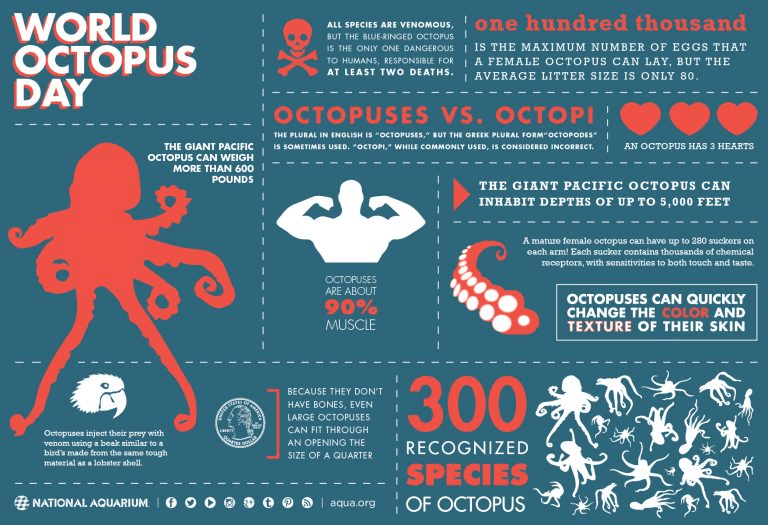
How many recognized species of octopus are there?

1

300

2

90

3

100,000

4

80

21

Multiple Choice

Question image

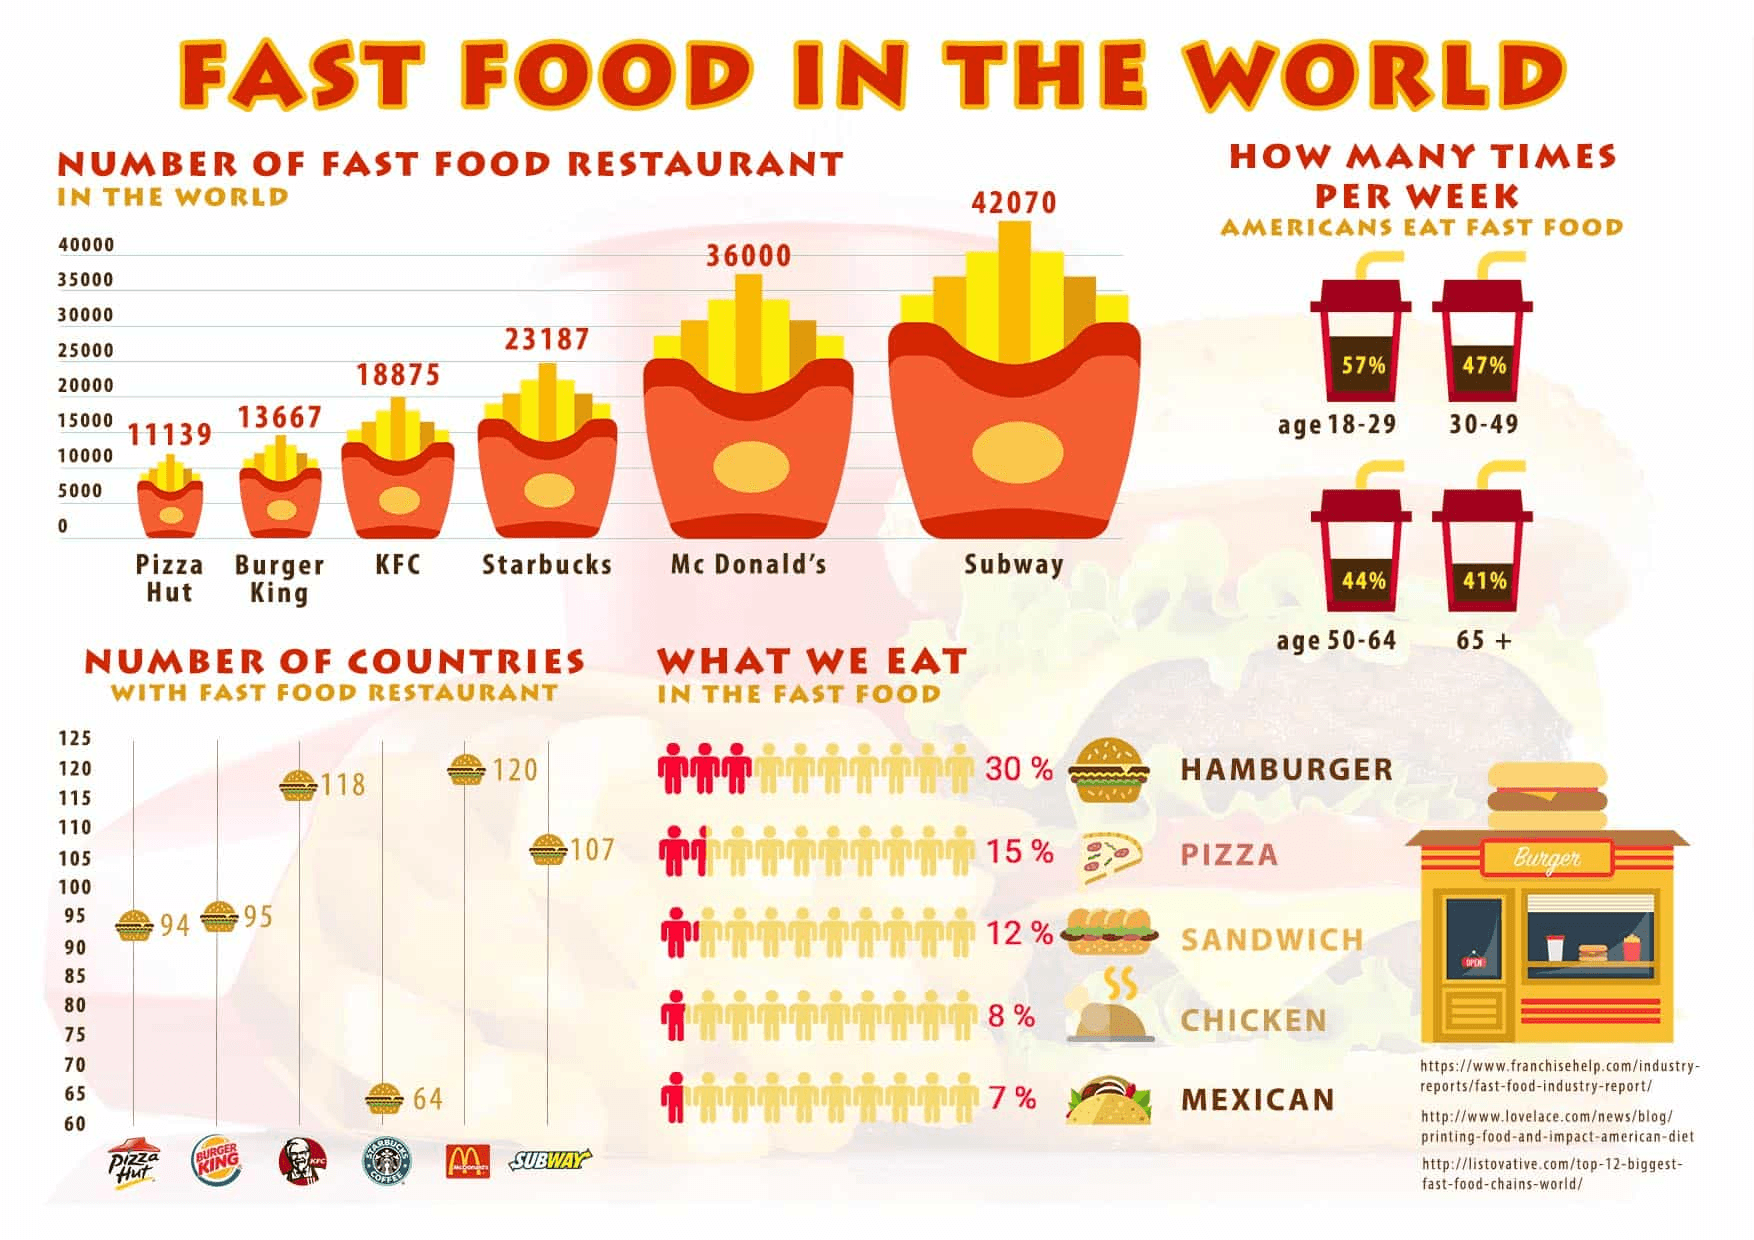
Which fast food restaurant has the most locations in the world?

1

McDonalds

2

Subway

3

KFC

4

Burger King

22

Multiple Choice

All but one are examples of inforgraphics.

1
2
3
4

23

Multiple Choice

What are three elements of a good infographics?

1

Complimentary colors, fun fonts, great graphics

2

Focused data, clear design and shareable story

24

Multiple Choice

Which does a good infographic use more of?

1

Images

2

Text

25

Multiple Choice

Most successful infographic use lots of colors

1

True

2

False

26

Multiple Choice

When creating an infographic you should have what?
1
A lot of pictures
2
A lot of content
3
Clear and concise information 
4
Pictures of your cat

27

Multiple Choice

Question image

This picture show the number of measles cases in Europe in 2018.

What is the country with the highest record?

1

Poland

2

France

3

Germany

4

the UK

28

Multiple Choice

Question image

What is the least popular group of items sole from this store?

1

Clothing

2

Houseware

3

Furniture

4

Toys

29

Multiple Choice

Question image

What percentage of sale is homeware?

1

25%

2

27%

3

30%

4

36%

30

media

31

Multiple Choice

Question image

Find the smallest number of books sold in a day from this period of time

1

106

2

30

3

32

4

34

32

Multiple Choice

Question image

On which day every week were the most books sold?

1

Monday (M)

2

Wednesday (W)

3

Thursday (T)

4

Week 1

33

Multiple Choice

Question image

Describe the trend in the number of books sold in these 4 weeks.

1

The number of books decreases.

2

The number of books increases.

3

The number of books stay the same.

4

The number of books go up and down.

34

media

35

Multiple Choice

Question image
1

A

2

B

3

C

4

D

36

Multiple Choice

Question image

Choose your answer

1

A

2

B

3

C

4

D

37

media

38

Multiple Choice

Question image
1

A

2

B

3

C

4

D

39

Multiple Choice

Question image
1

A

2

B

3

C

4

D

40

media

That is all!!!

You finished!​

Some text here about the topic of discussion.

Presenting and interpreting data

By Ngoc Anh

Show answer

Auto Play

Slide 1 / 40

SLIDE