Search Header Logo
  1. Resource Library
  2. Math
  3. Probability And Statistics
  4. Relative Frequency
  5. Joint And Marginal Frequency
Joint and Marginal Frequency

Joint and Marginal Frequency

Assessment

Presentation

Mathematics

9th - 12th Grade

Hard

CCSS
8.SP.A.4, 7.SP.C.8B, 6.RP.A.3C

Standards-aligned

Created by

Susan Budde

Used 932+ times

FREE Resource

6 Slides • 16 Questions

1

Joint and Marginal Frequency

By Susan Budde

2

Multiple Choice

The number of times the value appears in a data set.

1

Frequency

2

Joint Relative Frequency

3

Marginal Relative Frequency

4

Conditional Relative Frequency

3

media

Frequency means

the number of times a values appears in the data

Some text here about the topic of discussion.

4

media

This is a sample sales record for a small dealership.

Colors and Types of Vehicle are recorded; so are the totals.​

the type of information you are asked for is important. Are you looking at ONE characteristic or TWO characteristics.

Sales Record

5

Multiple Choice

Question image

What color car is the least often bought at this car dealership?

1
Red
2
White
3
Blue
4
Green

6

Multiple Choice

Question image

How many vehicles were bought at this dealership?

1

40

2

50

3

100

4

150

7

Multiple Choice

Question image

What color car is the most often bought at this dealership?

1
Red
2
White
3
Blue
4
Green

8

Multiple Choice

Question image

How many cars were bought at this dealership?

1

40

2

50

3

100

4

150

9

Multiple Choice

Question image

How many SUVs were bought at this dealership?

1

40

2

50

3

100

4

150

10

Multiple Choice

Question image

Which of these values below is a marginal frequency?

1

182

2

120

3

46

4

10

11

Multiple Choice

Question image

Which of the values below is a joint frequency?

1

400

2

200

3

182

4

4

12

Multiple Choice

Question image

The number of people who purchased a hot dog and a soda is an example of ___________.

1

Marginal Frequency

2

Joint Frequency

3

Marginal Relative Frequency

4

Joint Relative Frequency

5

Conditional Relative Frequency

13

Multiple Choice

Question image

48 male and 52 female students take a survey about their preferred sport. According to the chart, which sport was most popular among female students?

1

Baseball

2

Basketball

3

Football

4

Golf

14

media

percent means

OUT OF 100

Some text here about the topic of discussion.

15

media
media
media

The majority of the responses were good!

There are more white thumbs up​

​​Majority

The minority in this picture is the section of one person.

​​Minority

All possible outcomes

​​Sample Space

16

media

​Show all possible outcomes by making a tree diagram

Three Coins

​Show all of the possibilities by demonstrating with real items.

​​TWO coins

media

17

Multiple Choice

Question image
What percentage of the days that it rained, did they forecast no rain?
1
About 20%
2
About 18%
3
About 14%
4
About 12%

18

Multiple Choice

Question image

The majority of females were right-handed.

1

True

2

False

19

Multiple Choice

Question image

The majority of left handers are female.

1

True

2

False

20

Multiple Choice

Question image
Which shows the sample space for flipping two coins?
1
H, T
2
HH, HT, TH, TT
3
HH, TT
4
Dime, Nickel

21

Multiple Choice

Question image

Use the tree diagram to find the probability of tossing a head first and then a tail when a coin is tossed twice.

1

1

2

1/2

3

1/4

4

1/8

22

Multiple Choice

Question image

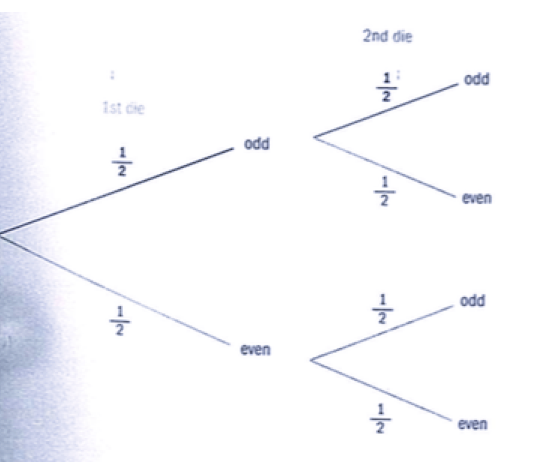
Two dice are rolled and it is recorded whether the result on each is odd or even. What is the probability both are odd?

1

1/4

2

1/2

3

2/4

4

3/4

Joint and Marginal Frequency

By Susan Budde

Show answer

Auto Play

Slide 1 / 22

SLIDE