
Scatter Plots Intro
Presentation
•
Mathematics
•
6th - 8th Grade
•
Medium

Judith Mandela
Used 1+ times
FREE Resource
4 Slides • 20 Questions
1

2

3

4
Multiple Choice

5
Multiple Choice

What type of association does this graph have?
6
Multiple Choice

7

8
Multiple Choice

What type of association does this graph have?
9
Multiple Choice

10
Multiple Choice

What type of association does this scatter plot show?
11
Multiple Choice

Based on the scatterplot, which of the following conclusions about the relationship between her height and weight is true?
12
Multiple Choice
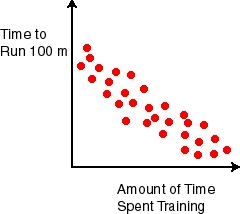
What type of association does this scatter plot show?
13
Multiple Choice

14
Multiple Choice

15
Multiple Choice

16
Multiple Choice

17
Multiple Choice
18
Multiple Choice
19
Multiple Choice
20
Multiple Choice

21
Multiple Choice

22
Multiple Choice

23
Multiple Choice

The following scatter plot shows Pam's training as she prepares to run a 6 mile race at the end of the month. Which of the following would be a reasonable approximation for the length of time it would take for her to run 6 miles?
24
Multiple Choice

Show answer
Auto Play
Slide 1 / 24
SLIDE
