Search Header Logo
PT C8.2 Collect Data

PT C8.2 Collect Data

Assessment

Presentation

Mathematics

4th Grade

Easy

Created by

Teacher Hearty

Used 6+ times

FREE Resource

13 Slides • 33 Questions

1

media
media

collect data

2

media

3

media

4

media

5

Multiple Choice

Question image

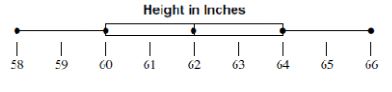
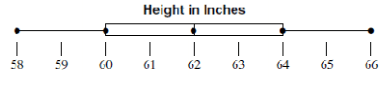
Which person has the higher upper extreme and what is that number?

1

Irene, 90 minutes

2

Janelle, 80 minutes

3

Irene, 80 minutes

4

Janelle, 70 minutes

6

Multiple Choice

For the data set shown, what is the lower extreme?

{15, 20, 9, 8, 10, 20, 25, 17}

1

15

2

17

3

8

4

0

7

Multiple Choice

4. Which of the following lists all parts of the five number summary?
1

Mean, Median, Mode, Range, and Total

2

Minimum, Quartile 1, Median, Quartile 3, and Maximum 

3

Smallest, Q1, Q2, Q3, and Q4

4

Minimum, Maximum, Range, Mean, and Median

8

Multiple Choice

Question image
9. What was the maximum amount someone spent on groceries?
1

40

2

60

3

140

4

150

9

Multiple Choice

Question image
Use the box plot to answer the question.
1

14

2

18

3

15

4

12

10

Multiple Choice

The range of a data set is the...

1

Middle Number

2

Average

3

Biggest minus smallest

4

Number that appears most ofen

11

Multiple Choice

What is the range?

1

The sum of the largest and smallest number

2

The number in the middle

3

The difference between the largest and smallest number

4

The number that appears most often

12

Multiple Choice

Bart had test scores of:   76, 94, 128, 60, 73, 88 What is the RANGE of his test scores?

1

12

2

72

3

68

4

98

13

Multiple Choice

Question image

Find the minimum.

5, 5, 9, 12,18, 22, 25,

1

5

2

8

3

4

4

9

14

Multiple Choice

Question image

What is the maximum?

1

64

2

65

3

66

4

67

15

Multiple Choice

Question image

What is the range of the data?

1

80

2

10

3

70

4

40

5

30

16

Draw

Organize these numbers then encircle the minimum, maximum and range.

8, 10, 60, 3, 5, 13, 12, 40, 9

17

media

18

media

​Even Number

​Odd Number

19

Multiple Choice

Question image

Mrs. Garcia decides to organize her students’ algebra test scores into

a box plot to analyze the results, as shown below.

What is the median score of the class?

1

76

2

80

3

82

4

84

20

Fill in the Blank

Question image

Find the median

4, 9, 10, 12, 15, 19, 22

21

Fill in the Blank

Example 1:

Find the median of 12, 34, 8, 16, 25, 3 and 10

Arrange the data in an increasing order.

2, 6, 11, 14, 16, 25, 34

The middle number is 12

What is the median?

22

Multiple Choice

What is the median of the following set of numbers?

(2, 24, 8, 6, 88, 45, 17)

1

24

2

17

3

45

4

8

23

Multiple Choice

The median of a data set is the...

1

Middle Number

2

Average

3

Biggest minus smallest

4

Number that appears most ofen

24

Multiple Choice

Question image

What is the median of the data?

1

10

2

12

3

13

4

14

5

18

25

Draw

Find the median - order them first

6, 2, 9, 1, 5, 7, 10, 11

26

Fill in the Blank

Example 2: Find the median of 5, 14, 22, 35, 20, 15, 6 and 28 Arrange the data in an increasing order 5, 6, 14, 15, 20, 22, 28, 35

27

media

28

media

29

Draw

Find the Quartile 3 of these numbers:

2, 3, 4, 5, 5, 5, 7,

30

Draw

In the set of the scores: 4, 1, 5, 2, 6, 5, 3, 8, 7,and 9, what is the median or 2nd quartile, Quartile 1 and Quartile 3?

31

Multiple Choice

Question image
What data value is the upper quartile (Q3)?
1

64

2

62

3

66

4

58

32

media

33

media

34

media

35

media

36

Draw

Plot the Points

37

Multiple Choice

Question image
What is the interquartile range (IQR)?
1

4

2

64

3

60

4

8

38

Multiple Choice

Question image
Q6
1

A

2

B

3

C

4

D

39

media

40

Multiple Choice

Find the interquartile range using the following.
Minimum:  1
Q1:  3
Median:  5
Q3:  7
Maximum:  9
1

8

2

4

3

5

4

10

41

Multiple Choice

find the lower quartile of the following set of scores12, 9, 4, 6, 5, 8, 9, 4, 10, 2
1

10

2

4

3

9

4

6

42

Draw

Calculate the interquartile range of the following 20 scores

2, 3, 5, 7, 9, 11, 15, 17, 19, 20, 20, 21, 23, 30, 31, 32, 33, 35, 37, 40

43

Multiple Choice

Mrs. Jones surveyed the class for the number of letters in their given first name. The data is recorded below.
{5, 8, 6, 5, 4, 9, 8, 7, 6, 3, 8, 7, 5, 6, 7, 8}
What is the interquartile range of the data?
1

2

2

3

3

7

4

8

44

Multiple Choice

Find the interquartile range using the following data.
18, 15, 22, 16, 17, 15, 12, 22, 13
1

34

2

16

3

6

4

10

45

Multiple Choice

2. Which of the following best describes the process of finding the interquartile range for a set of data?
1

ADD the biggest and smallest numbers

2

Place the number in order from least to greatest then find the middle.

3

Find the difference between the Maximum and the Minimum.

4

Subtract Q3 from Q1

46

Multiple Choice

1,3,5,7,9,11,13,15

Which Box plot belongs to the data above?

1
2
3
4
media
media

collect data

Show answer

Auto Play

Slide 1 / 46

SLIDE