6th Grade 8-3 Reateach (Day #2)
Presentation
•
Mathematics
•
6th Grade
•
Practice Problem
•
Hard
LeAnne Gilliland
FREE Resource
12 Slides • 6 Questions
1
6th Grade Topic 8-3
Reteach (Day #2)
2
3
4
Multiple Choice
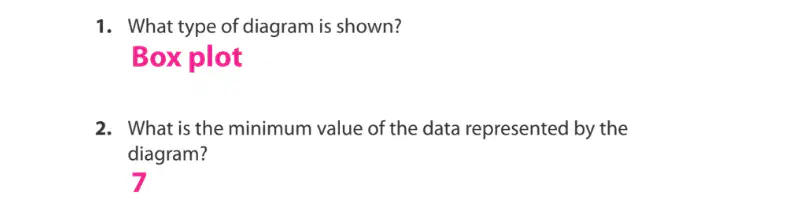
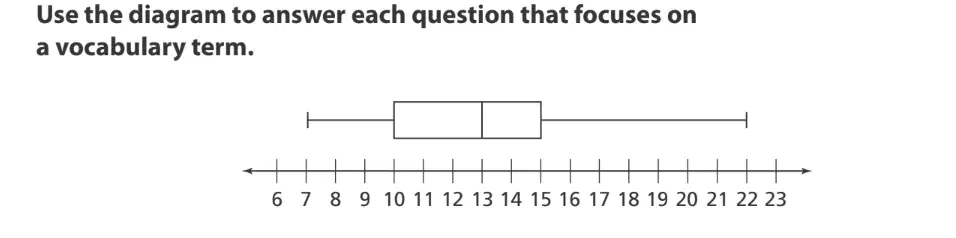
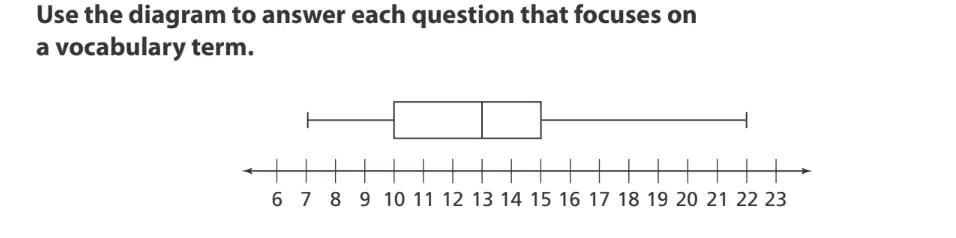
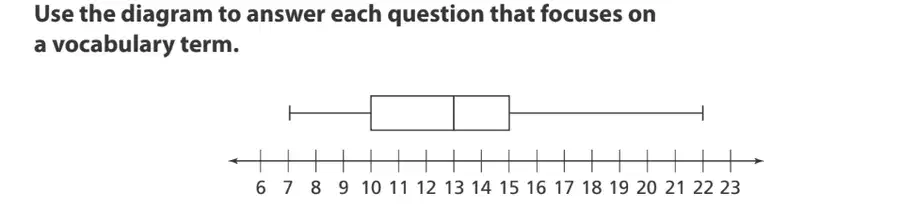
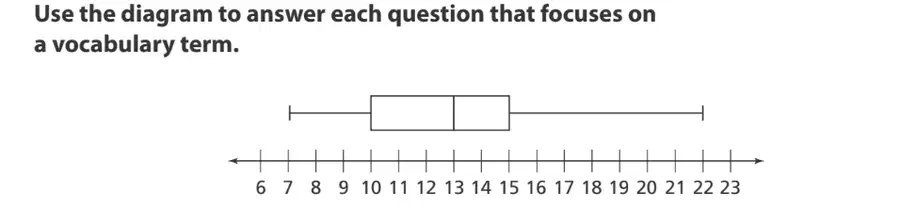
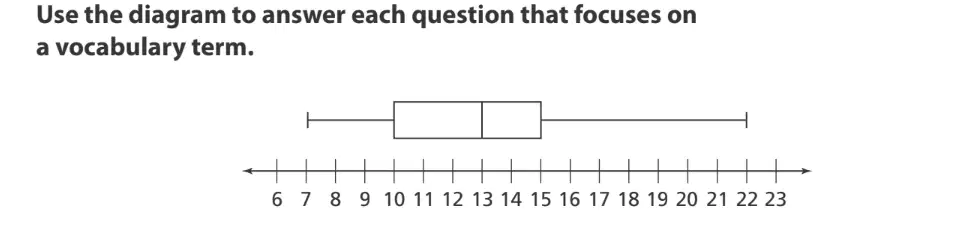
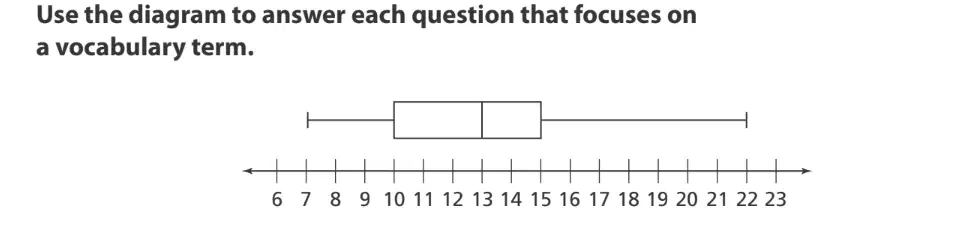
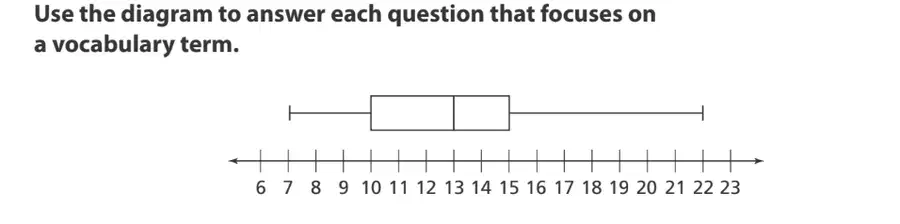
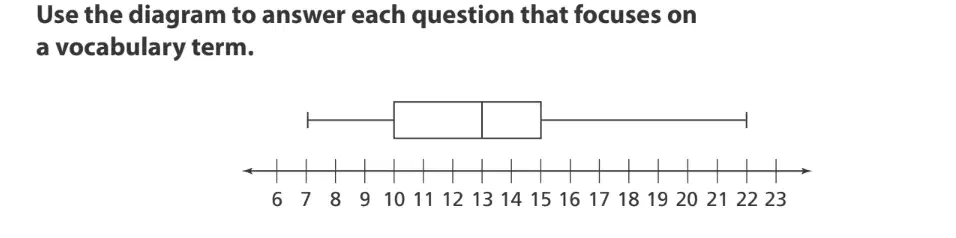
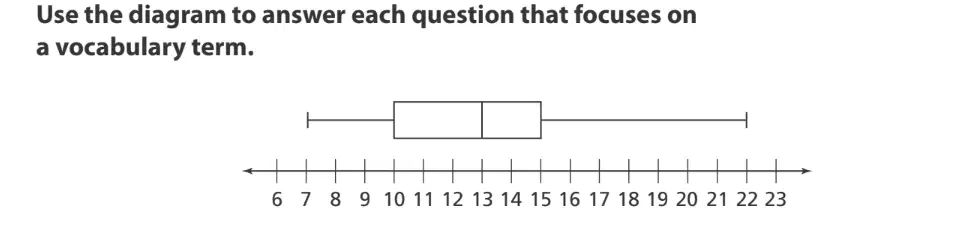
What type of diagram is shown?
Box Plot
Number Plot
Bar Diagram
Line Plot
5
6
Multiple Choice
What is the minimum value of the data represented by the diagram?
6
7
10
15
7
8
9
Multiple Choice
What is the value of the median?
10
13
15
16
10
11
Multiple Choice
What is the maximum value of the data represented by the diagram?
15
22
23
25
12
13
14
Multiple Choice
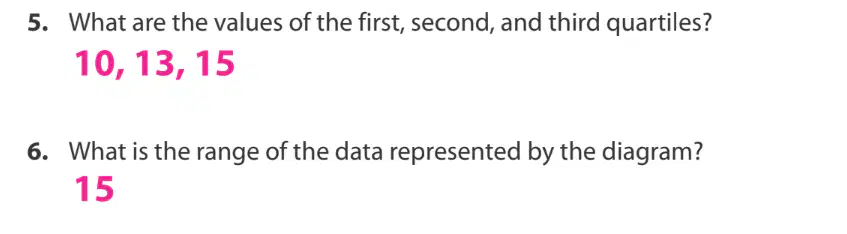
What are the values of the first, second, and third quartiles?
10, 13, 15
7, 13, 22
2, 4 ,6
6, 12, 34
15
16
Multiple Choice
What is the range of the data represented by the diagram?
12
13
14
15
17
18
Progress Check:
6th Grade Topic 8-3
Reteach (Day #2)
Show answer
Auto Play
Slide 1 / 18
SLIDE

Similar Resources on Wayground
15 questions
Area of Trapezoids
Presentation
•
6th Grade
15 questions
multiplication facts
Presentation
•
6th Grade
15 questions
Surface area of prisms
Presentation
•
6th Grade
15 questions
Adding and Subtracting Fractions and Mixed Numbers (Same Denominator)
Presentation
•
6th Grade
13 questions
Fracciones
Presentation
•
6th Grade
12 questions
Probabilidad
Presentation
•
6th Grade
15 questions
Area of Shapes
Presentation
•
6th Grade
11 questions
Graphical Representations of Data
Presentation
•
6th Grade
Popular Resources on Wayground
10 questions
HCS SCI 03 Summer School Review 4
Quiz
•
3rd Grade
11 questions
HSMS - Standard Response Protocol
Quiz
•
6th - 8th Grade
16 questions
1.1-1.2 Quiz Review
Quiz
•
9th - 12th Grade
12 questions
Exponent Expressions
Quiz
•
6th Grade
20 questions
Adding and Subtracting Integers
Quiz
•
6th - 7th Grade
11 questions
Northeast States
Quiz
•
3rd - 4th Grade
10 questions
Characterization
Quiz
•
3rd - 7th Grade
10 questions
Common Denominators
Quiz
•
5th Grade