Search Header Logo
  1. Resource Library
  2. Math
  3. Data And Graphing
  4. Qualitative Graphs
  5. Qualitative Graphs
qualitative graphs

qualitative graphs

Assessment

Presentation

Mathematics

8th Grade

Medium

CCSS
HSF.IF.B.4, 8.EE.B.5, HSF-LE.A.1B

+1

Standards-aligned

Created by

kathie george

Used 327+ times

FREE Resource

7 Slides • 24 Questions

1

QUALITATIVE GRAPHS

2

Qualitative Graph

is a graph used to represent situations that may not have numerical values or graphs where numerical values are not included.

3

​example of a qualitative graph

Notice there are NO numbers on the graph!

media

4

Multiple Choice

Question image

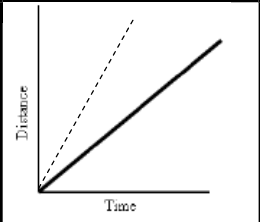
This is an example of a qualitative graph because

1

it is non-linear

2

it is linear

3

the graphs represents data without number values

4

all of the above

5

When analyzing a qualitative graph, look out for the following item:

Is the line linear or non-linear.

If the graph is linear, it is changing at a constant rate.

6

Multiple Choice

Which graph below show a graph that is changing at a constant rate?

1
2

7

Also look out for how the graph changes:

Increasing - going up

Decreasing - going down

Constant - no change

media

8

Multiple Select

Question image

Which part of this graph shows no change happening? Select all that apply.

1

a

2

b

3

c

4

d

5

e

9

Multiple Select

Question image

Which part of this graph shows no change happening? Select all that apply.

1

a.

2

b.

3

g.

4

d.

5

f.

10

Multiple Choice

Question image
What does this graph represent?
1

Constant Speed

2

Acceleration

3

Not moving

11

Multiple Choice

Question image

Which part of this graph shows no change happening?

1

A

2

B

3

C

4

D

12

Multiple Choice

When the slope of a line is negative the function is ...

1

Constant

2

Decreasing

3

Increasing

4

Not Negative

13

Multiple Choice

Question image

Which part of this graph shows the graph is decreasing?

1

A

2

B

3

C

4

D

14

Multiple Select

Question image

Which parts of this graph shows the graph is increasing? (Select all that apply)

1

A

2

B

3

C

4

D

15

Multiple Select

Question image

The intervals the graph is decreasing is at

1

When x is between 0 and 2

2

When x is between 4 and 5

3

When x is between 6 and 10

4

When x is between 0 and 6

16

Multiple Select

Question image

The intervals the graph is increasing is at (select all that apply)

1

When x is between 0 and 2

2

When x is between 4 and 5

3

When x is between 5 and 6

4

When x is between 0 and 6

17

Multiple Choice

Question image

The intervals the graph is constant at

1

When x is between 0 and 2

2

When x is between 4 and 5

3

When x is between 6 and 10

4

When x is between 2 and 4

18

When you analyze a qualitative graph, you tell the story of what is happening.

19

media
  1. In the beginning the water level is at zero.

  2. ​The water level increases at a constant rate.

  3. The water is turned off and the level does not change.

  4. Finally, the drain is pulled, and the water decreases at a constant rate until the tub is empty.

The graph is comparing water levels and time.

20

Multiple Choice

On a graph comparing speed over time, a section of line with a negative slope means
1

that you are going downhill.

2

that you are going uphill.

3

that your speed is increasing.

4

that your speed is decreasing.

21

Multiple Choice

On a graph comparing distance over time, a section of line with a positive slope means
1

the distance is decreasing.

2

the distance is staying the same.

3

the distance is increasing

4

the distance varies.

22

Multiple Choice

Question image

Michael owns his own window cleaning business. He is cleaning the windows of a three story building. The graph shows his height from the ground floor while washing windows. Choose the correct words to correctly describe each section of the graph.

Section B has a _____ slope and represents going to the _____ floor.

1

zero; first

2

positive; second

3

negative; third

4

zero; second

5

positive; third

23

Multiple Choice

Question image

Michael owns his own window cleaning business. He is cleaning the windows of a three story building. The graph shows his height from the ground floor while washing windows. Choose the correct words to correctly describe each section of the graph.

Section F has a _____ slope and represents going to the _____ floor.

1

zero; first

2

positive; third

3

negative; first

4

zero; second

5

negative; third

24

Multiple Choice

Question image
1

F

2

H

3

G

4

I

25

Multiple Choice

Question image
1

A

2

B

3

C

4

D

26

Multiple Choice

Question image

The graph shows the speed of Mr. Sam driving to work. Which section shows Mr. Sam stopped in traffic?

1

a.

2

b.

3

g.

4

d.

5

f.

27

Multiple Choice

Question image

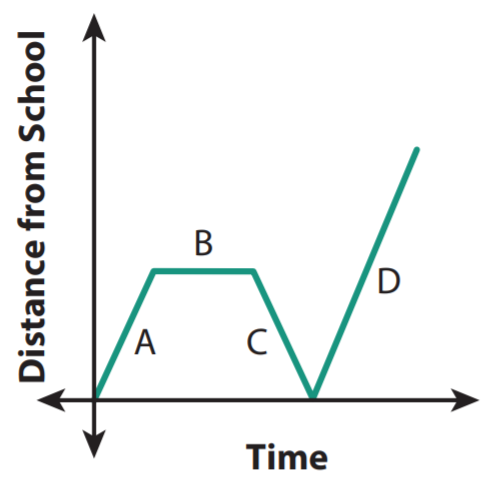
The graph shows Timmy's distance he is as he leaves school one afternoon. What happens in section C? Why is the distance from school decreasing?

1

Timmy is walking back to school because he forgot his math book.

2

Timmy is talking to a friend and not walking.

3

Timmy is walking faster home.

4

Timmy is dancing in the street.

28

Multiple Choice

Question image

The graph shows Timmy's distance he is as he leaves school one afternoon. What happens in section D?

1

Timmy is walking back to school because he forgot his math book.

2

Timmy is talking to a friend and not walking.

3

Timmy is walking all the way home.

4

Timmy is dancing in the street.

29

Multiple Choice

Question image
1

F

2

G

3

H

4

I

30

Multiple Choice

Question image

Choose the graph that best depicts a woman climbing a hill at a steady pace and then starts to run down one side. BE CAREFUL! Remember the what the graph is about.

1

a

2

b

3

c

4

d

31

Poll

How do you feel about qualitative graphs?

The struggle is real!

I get it some of the time.

I get it most of the time.

This is a breeze!

QUALITATIVE GRAPHS

Show answer

Auto Play

Slide 1 / 31

SLIDE